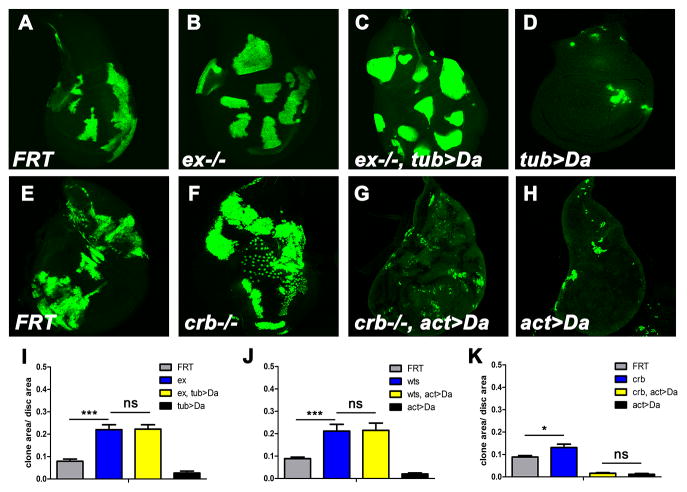
Figure 2. Da Over-expression acts upstream of ex.
(A–D) Third instar wing imaginal discs with positively marked MARCM clones stained for GFP (green, to mark the clones). wild-type control (A), exe1 (B), exe1, tub>Da (C), and tub>Da (D). Although clones of exe1 or exe1, tub>Da grew well, tub>Da clones were rarely recovered in the disc proper. (E–H) Third instar wing imaginal discs with wild-type control (E), crb82-04 (F), crb82-04, act>Da (G), and act>Da (H). Loss of crb did not affect clone loss when Da was over-expressed. (I–K) Quantification results of A–D, E–H and Figure S2A–D, respectively. 10 discs of each genotype are analyzed. Areas of clones are normalized to the total wing disc area. Mean±SEM is shown, significance assessed with Student’s t-test; *** P<0.001; ** P<0.01; * P<0.05; NS, not significant. See also Figure S2.

