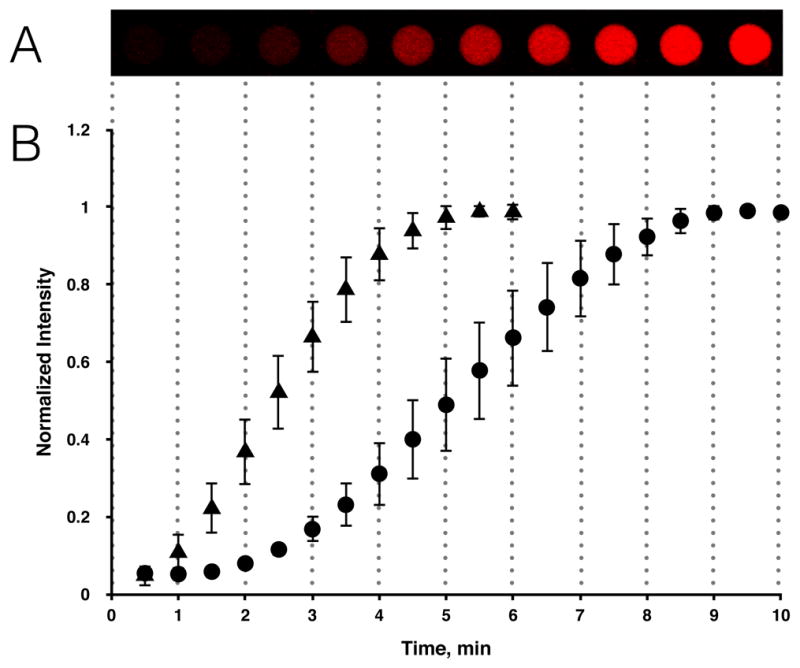
Figure 4.

The rate of fluorescence increase in GLUT1-swelled giant vesicles exposed to different exterior glucose concentrations. (A) The image sequence shows a single giant vesicle at intervals of 1 min after addition of 1 mM glucose. (B) Plot depicting the mean pixel intensity of interior vesicle area normalized to the maximal fluorescence response observed upon saturation of resorufin for 1 mM glucose (circles, n=5) compared to the fluorescence response of 4 mM glucose (triangles, n=10). The mean linear rate constants were calculated to 0.286 min−1 for 4 mM glucose and 0.167 min−1 for 1 mM glucose, respectively. Error bars represent standard deviations.
