
Figure 1.
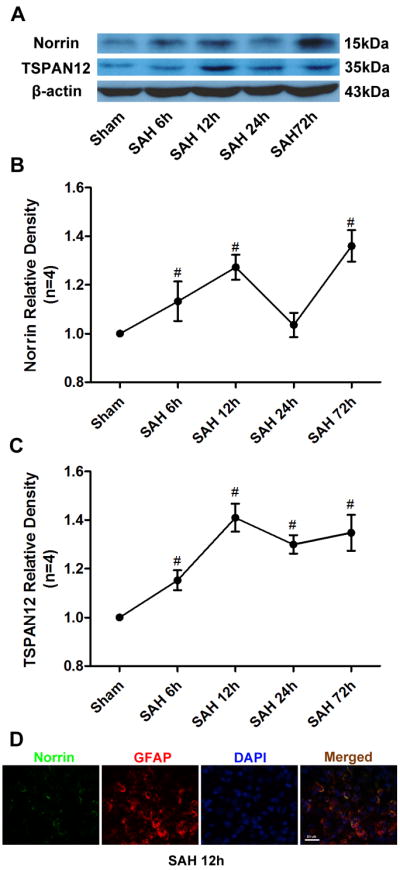
Time course of endogenous Norrin and TSPAN12 expression after SAH. (A) Representative western blot bands of Norrin and TSPAN12 time course from ipsilateral hemisphere after SAH. Quantitative analyses of (B) Norrin and TSPAN12 (C) time course from ipsilateral hemisphere after SAH. (D) Representative immunohistochemistry staining slices of Norrin and GFAP at 12 hours after SAH. GFAP= Glial Fibrillary Acidic Protein. Relative densities of each protein have been normalized against the sham group. n=4 #: vs. Sham P<0.05.