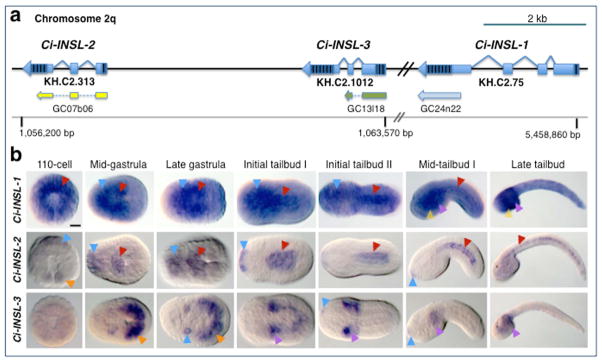
Figure 1. Genomic organization and embryonic expression of Ciona insulin-like genes.

a: Schematic representation of the regions of Ciona intestinalis chromosome 02q that contain the genomic loci of Ci-INSL-2, Ci-INSL-3 and Ci-INSL-1. Genes are represented as light-blue bars (exons) and angled lines (introns); striped areas indicate untranslated regions. Current gene model identifiers are indicated underneath each gene. The ESTs used for in situ hybridizations are depicted below each gene model in yellow, green, and light blue, respectively, along with the coordinates that allow their identification within the Ciona intestinalis Gene Collection (Satou et al., 2002). A grey horizontal line symbolizes the chromosomal DNA and reports the location of essential mapping landmarks in base pairs (bp). b: Microphotographs of Ciona intestinalis whole-mount embryos at the stages indicated on top of each column, hybridized in situ with digoxygenin-labeled antisense RNA probes synthesized from the EST clones shown in a, essentially as previously described (Oda-Ishii and Di Gregorio, 2007). Gene names are indicated on the left side of each row. 110-cell embryos are shown in vegetal views, the remaining embryos are shown with anterior to the left. Arrowheads point at representative regions of larger structures, and are color-coded as follows: red, notochord; blue, nervous system and primordium of the adhesive organ, which represents the anterior-most structure in tailbud embryos; orange, muscle precursors; purple, mesenchyme; yellow, endoderm. Scale bar: ~25 microns.
