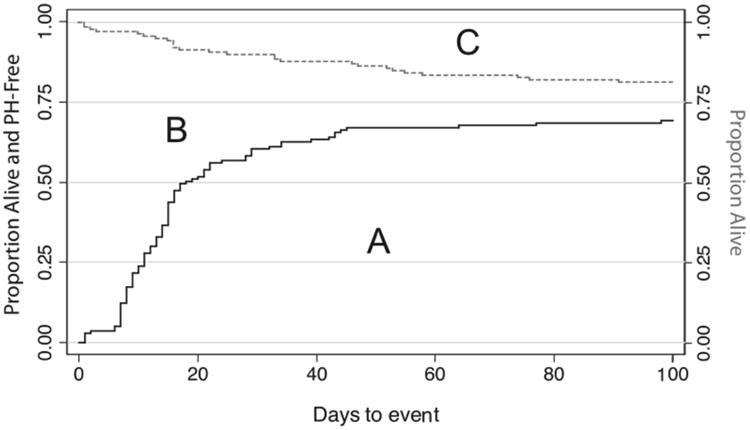
Figure 1.

Kaplan-Meier curves showing the time to resolution of pulmonary hypertension (black solid line), and time to death (grey dashed line) among study infants. Area A Represents the proportion of infants alive and PH-free; (B) represents the proportion of infants alive with PH; (C) represents the proportion of infants died.
