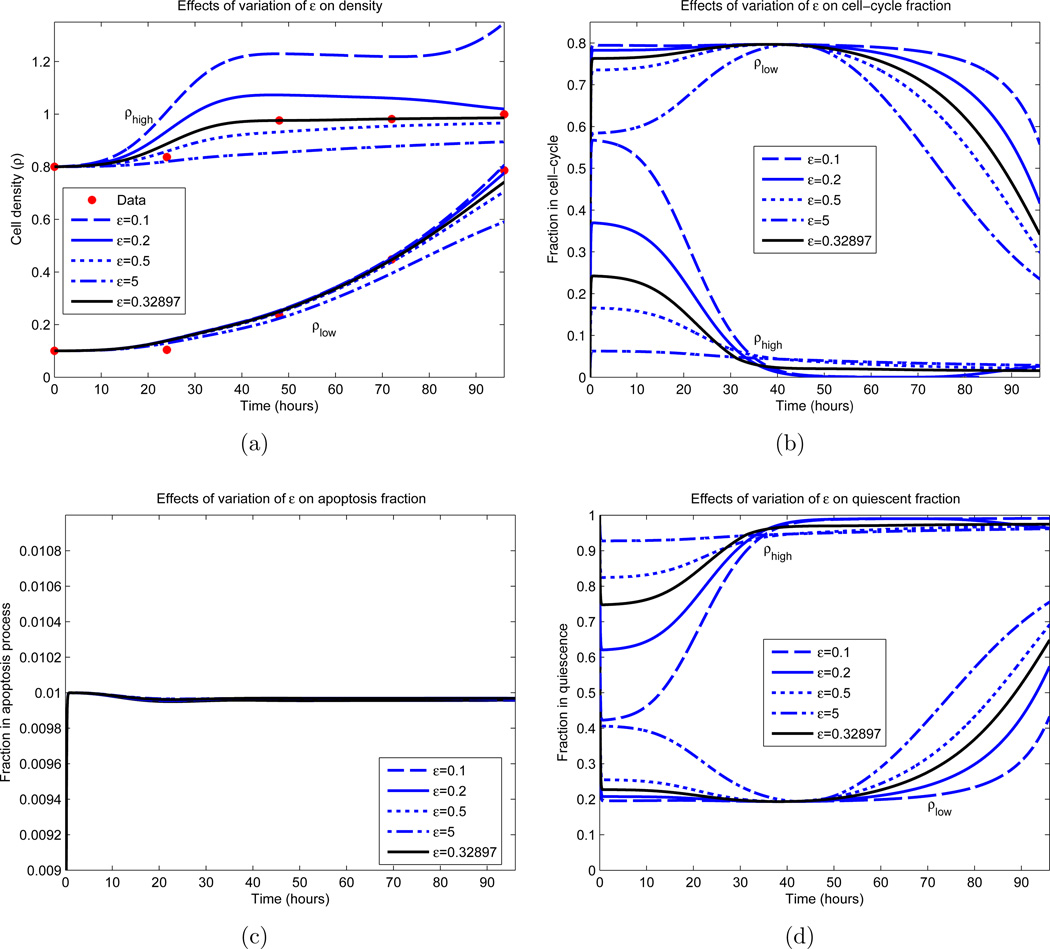
Figure 10.
Dependence of IDE solution on ε. All parameters, excluding ε, are fixed and obtained from an optimization appearing in Figure 8 (green curves). The parameter values are c = 12.19 cells per hour, βm = 0.8, ρm = 0.2, d = 0.01, γ = 0.5 and σ = 8.92 hours. The black curve represents the local minimizer. (a) Cellular density ρ; (b) Proliferative compartment; (c) Apoptotic compartment; (d) Quiescent compartment.

