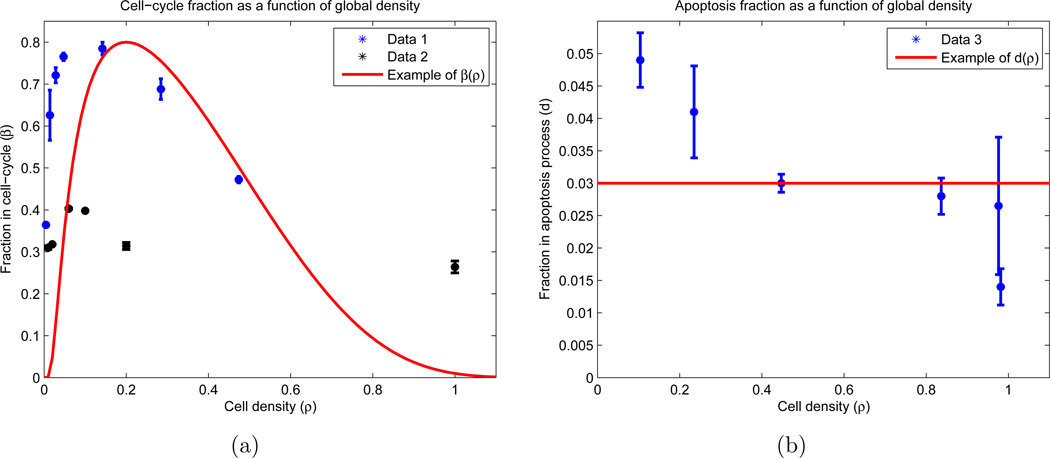
Figure 2.
Experimental results with functional forms for cell-cycle and apoptosis fractions. Experimentally (blue and black), OVCAR-8 cells are allowed to attach to the plate for twenty-four hours, and then are incubated for a subsequent twenty-four hours. After this incubation, the cells were stained to determine which percentage of cells reside in the proliferation and apoptosis stages. The experiment was performed using two different techniques for cell synchronization: Data 1 and Data 2 (see AppendixB.1.1 for details). The functional forms (red) correspond to equations (4) and (3), with free parameters taking values βm = 0.75, ρm = 0.15, ε = 1, and d = 0.03. (a) Fraction of cells in division stage (P) as a function of the population density on the plate; (b) Fraction of cells in apoptosis stage (A) as a function of the population density on the plate. Note that we allow ρ > 1.

