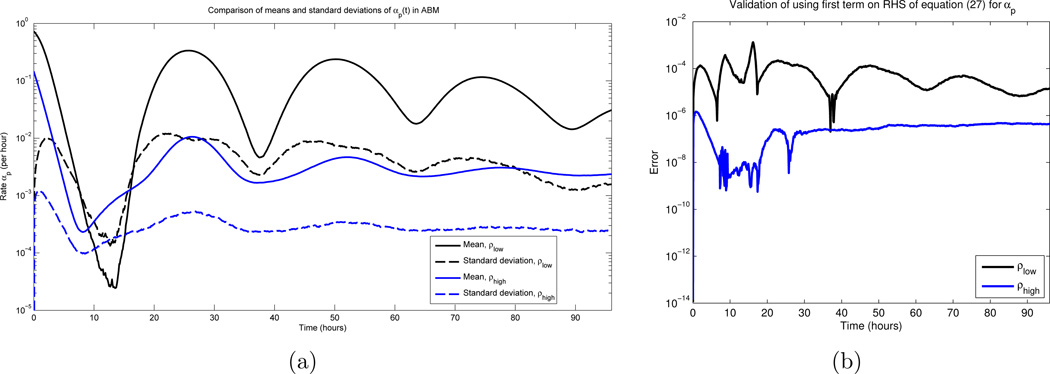
Figure 3.
(a) The mean and standard deviation of αp(t) over all times t ∈ [0, 96] hours, for 1000 Monte Carlo simulations. β and d appear as the red curves in Figures 2(a) and 2(b) respectively, and σ = 3 hours, c = 1 cell per hour. See equations (51) and (52) for the two sets of initial conditions. Note that the standard deviations are roughly an order of magnitude smaller than the mean values, for most times. (b) Error obtained in using the first term on the RHS in equation (27) as an approximation for αp(t)

