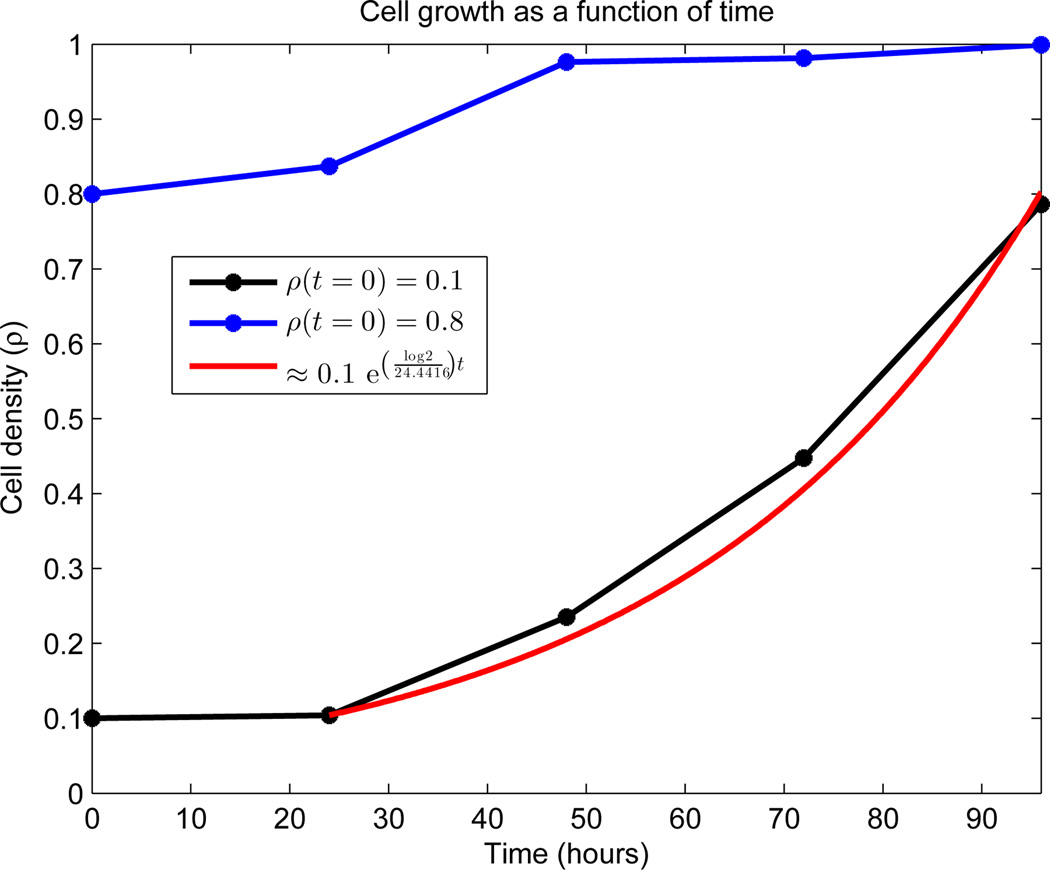
Figure 4.
Growth dynamics of OVCAR-8 human ovarian carcinoma cell line. Global density is measured on the vertical axis as a function of time. Both initial densities (ρ(0) = 0.1 and ρ(0) = 0.8) were generated by random seeding on a 24-well plate and cultured 24 hours prior to the first image. Data was collected every 24 hours, as indicated by stars. No data exists between the points, and the connecting line segments are added merely for viewing elucidation. The estimated density percentage is based on the average of two complete wells. The red curve represents a least-squares fit to the region of exponential growth, with doubling time μ = 24.4416 hours.

