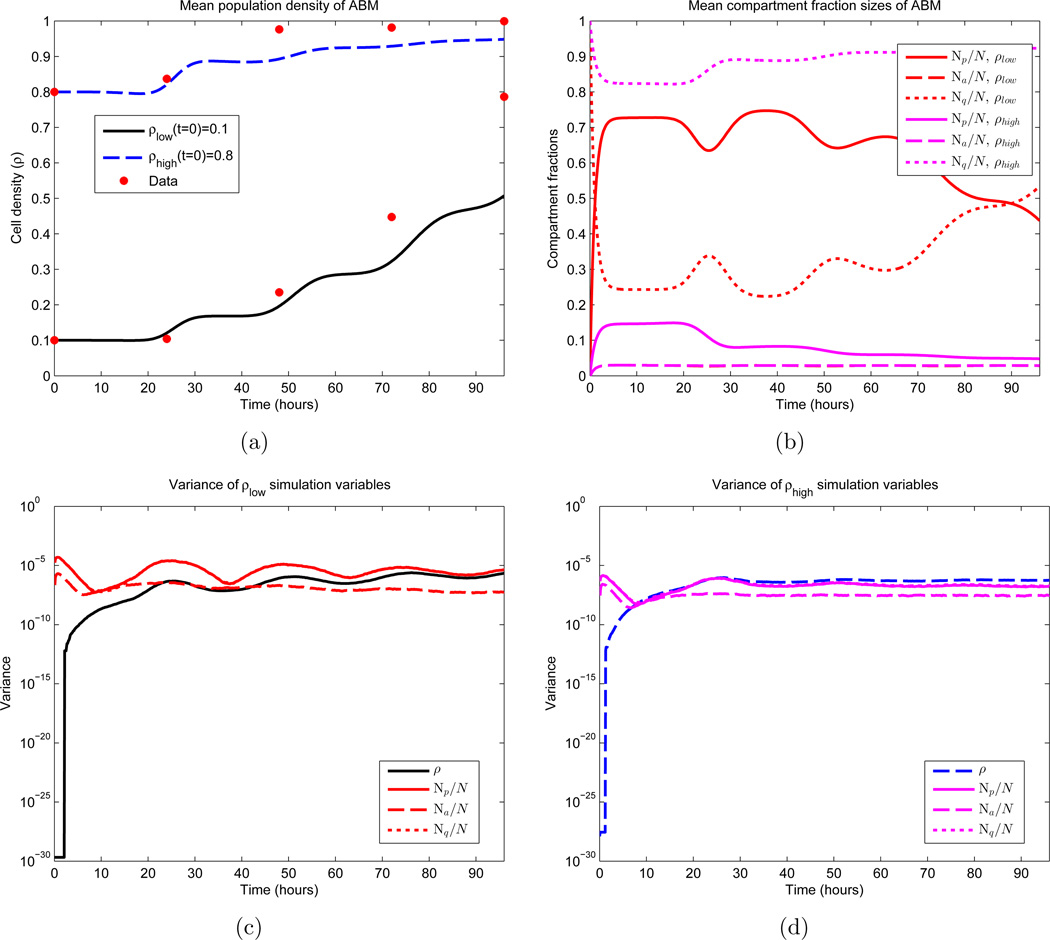
Figure 6.
First and second moments of the ABM. Shown are the temporal dynamics of the mean and variance of 1000 Monte Carlo simulations. β and d appear as the red curves in Figures 2(a) and 2(b) respectively, and σ = 3 hours, c = 1 cell per hour, γ= 0.70. Note that these parameters do not yield an optimal fit. See equations (51) and (52) for the two sets of initial conditions. In (b), the values of Na for both sets of initial conditions essentially overlap, making them difficult to distinguish. The same is true for the variances of Np and Nq in (c) and (d). (a) Sample means for the population density; (b) Sample means for the three cellular compartments; (c) Variances for simulations that satisfy ρ(0) = 0.1; (d) Variances for simulations that satisfy ρ(0) = 0.8.

