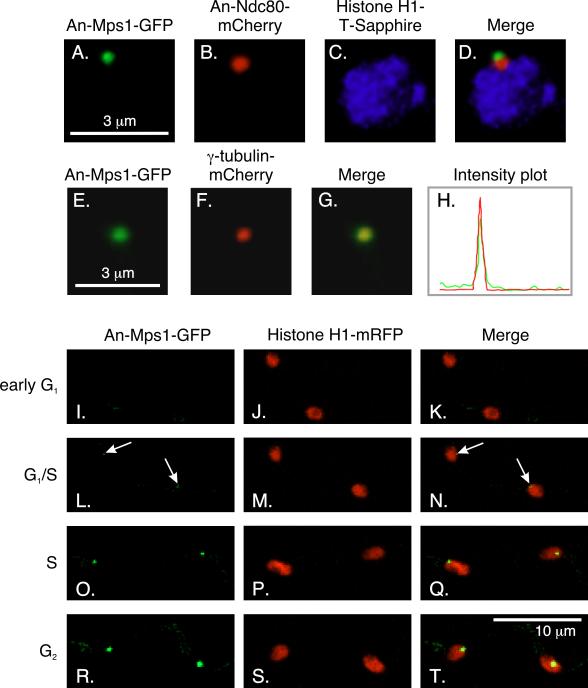
Fig. 2.
Localization of An-Mps1. A-D: An-Mps1 localizes adjacent to An-Ndc80 in interphase. An-Ndc80 is a KT marker that localizes adjacent to the SPB in interphase. E-H: An-Mps1 co-localizes with the SPB marker γ-tubulin in interphase. An-Mps1-GFP and γ-tubulin-mCherry co-localize perfectly. The co-localization is verified by intensity traces in the mCherry (red) and GFP (green) channels across the same region. The trace was vertical and covered a region slightly larger than the field shown. Images A-D and E-G are three-dimensional projections of through-focus Z-series image stacks. I-T: Z-stack projection images from a time-lapse data set collected at 10 min intervals at 25°C showing the localization of An-Mps1 through the cell cycle. I-K: An-Mps1 is not visible through most of G1, but it becomes faintly visible at G1/S (arrows; L-N). The An-Mps1-GFP signal becomes brighter through S (O-Q) and G2 (R-T).

