Fig. 6.
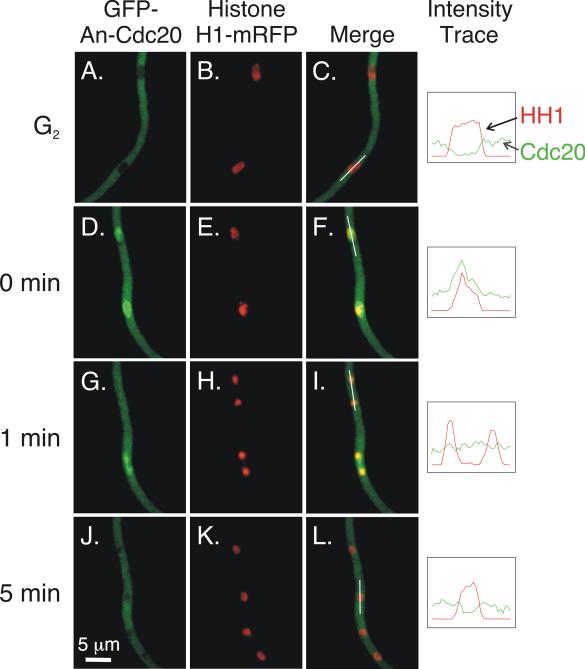
Localization of An-Cdc20 in interphase and mitosis. Images are Z-stack projections captured at 30°C and were taken from the same data set. Intensity traces of histone H1-mRFP and GFP-An-Cdc20 over the path of the white lines shown in C, F, I, and L are in the right-most column. The traces were created by Volocity software and were made using one optical section in the Z-series stack to minimize signal from out of focus fluorescence. A-C: Two nuclei in an interphase cell. An-Cdc20 is at relatively low levels in the cytoplasm. D-L: Another hypha in the same data set that is going through mitosis. Two nuclei are in prophase in D-F, and An-Cdc20 has become concentrated in the nucleoplasm. G-I show the same field captured one min later. In the telophase nucleus at the top, An-Cdc20 is present at approximately the same level as in the surrounding cytoplasm. A concentration of An-Cdc20 is visible in the bottom nucleus, which is in late anaphase. J-L: At the five min time point, in early G1, GFP-Cdc20 levels in the daughter nuclei have decreased.

