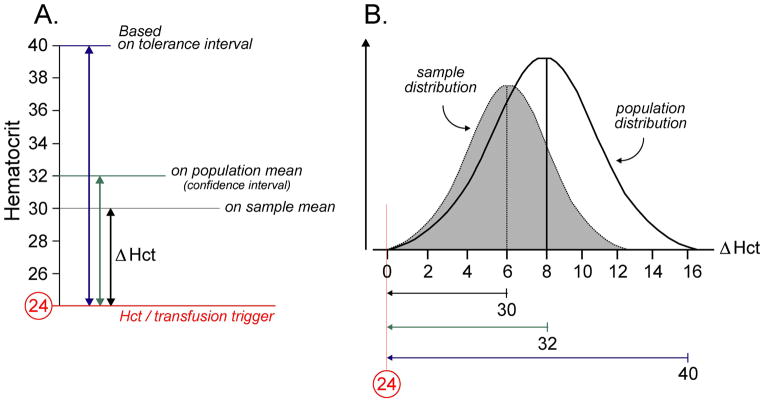
Figure 3.
(A) Average change in postoperative Hct (Δ Hct) as defined as the difference in initial PACU Hct and the postoperative Hct nadir during the entire hospital stay. Since the postoperative trigger for PRBC administration in this patient population at our institution is 24 and Δ Hct in our sample is 6, the threshold for initial PACU Hct was set at 30 for analysis. (B) Schematic of Δ Hct sample and population distributions. If the initial PACU Hct threshold is based on the approximate Δ Hct population mean (derived from the upper limit of the 95% confidence interval), roughly half of the possible Δ Hct values will not be accounted for and this may lead to a number of patients receiving postoperative PRBC transfusions. This transfusion risk may be lessened by accounting for almost the entire Δ Hct population distribution (approximately 97.5%) through the use the upper limit of the (0.95, 95%) tolerance interval derived from the patient sample.

