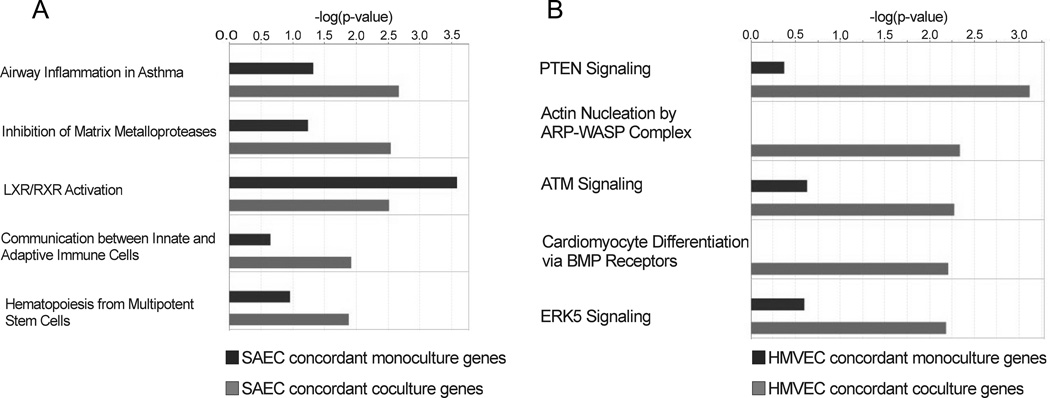
Figure 2.
IPA analysis of monoculture and coculture concordant genes. All SAEC and HMVEC monoculture and coculture concordant genes were uploaded to IPA and analyzed using the Core Analysis tool. The core analyses were then compared using the Comparison Analyses tool. The top 5 pathways and p-values for SAEC (A) and HMVEC (B), based upon the number of genes represented in a given pathway, are shown.

