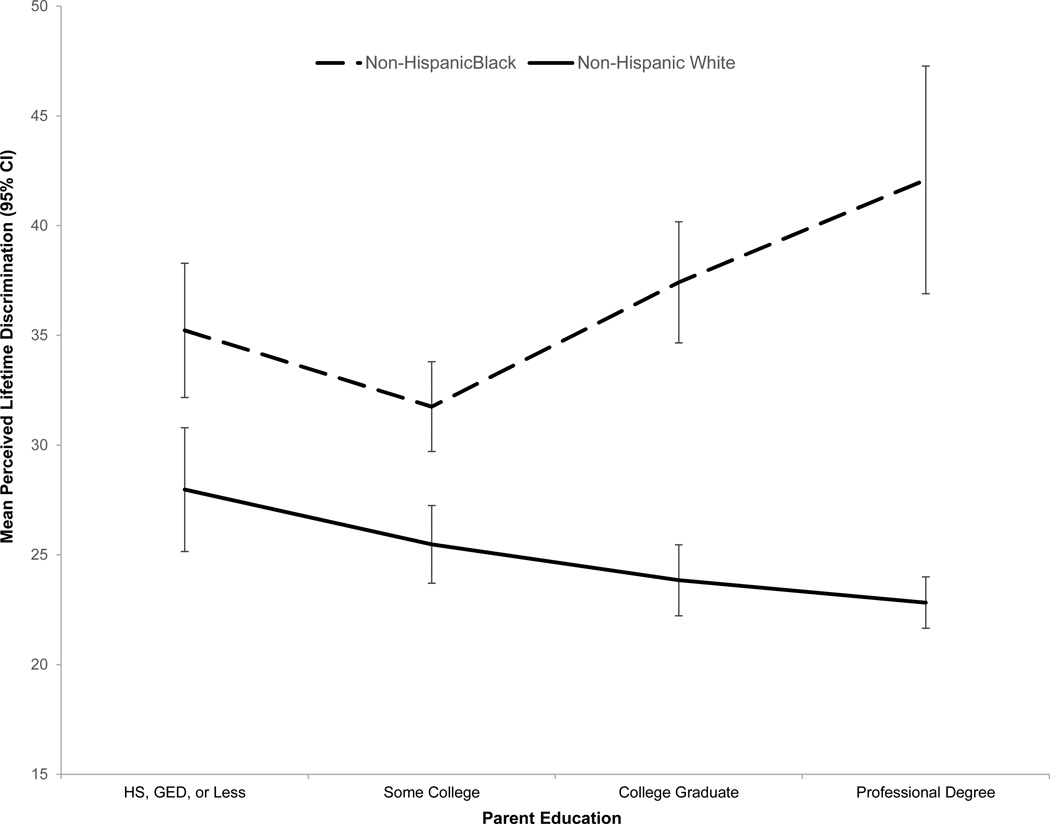
Figure. The Relationship of Perceived Lifetime Discrimination and Parental Education by Race/Ethnicity.
Mean perceived lifetime discrimination and 95% confidence intervals for each level of parent education are shown by race/ethnicity. The solid line represents non-Hispanic whites and the dashed line non-Hispanic blacks.

