Figure 1.
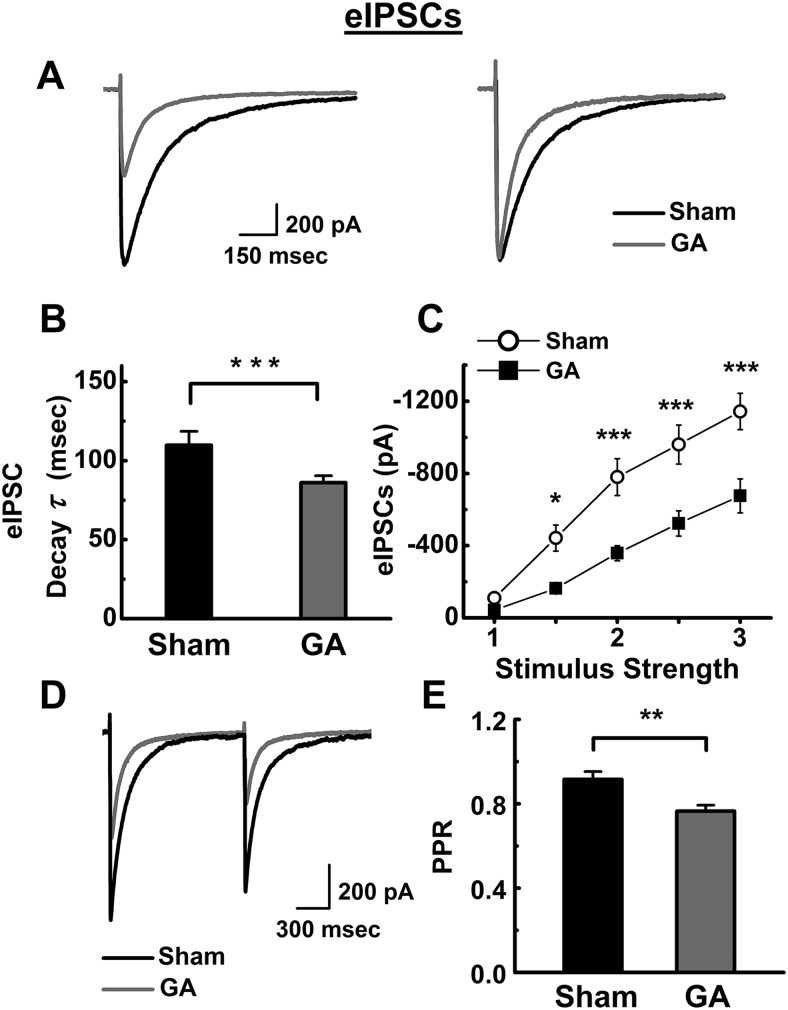
Alterations in eIPSCs of nRT neurons mediated by GA exposure. A, Left, Averaged traces from nRT neurons from the sham group (black trace) and the GA-exposed group (gray trace). Right, Same traces of eIPSCs as in A that are scaled for easier comparison. There is faster decay of current in the GA group. B, Decay time constants are decreased in the GA (13 rats, 45 neurons) versus the sham (23 rats, 63 neurons) group (***p < 0.001 by LMM). C, The averaged data of I-O curves show decreased synaptic strength of eIPSCs in the GA group (■, 12 rats, 41 neurons) versus the sham group (○, 15 rats, 52 neurons). *p < 0.05 (SNK post hoc test). ***p < 0.001 (SNK post hoc test). We first determined threshold stimulus (denoted as 1) in each experiment; then we used progressively stronger stimuli 1.5-, 2-, 2.5-, and 3-fold higher than the threshold stimulus. D, Averaged traces of paired-pulse stimulus protocol separated by 1 s show eIPSCs in sham group (black trace) and GA group (gray trace). E, Bar graph shows that, in GA-treated animals (13 rats, 37 neurons), the average PPR ratio is significantly decreased compared with that in sham-treated animals (19 rats, 56 neurons). **p < 0.01 (LMM). B, C, E, All symbols represent mean values grouped by animal ± SEM.

