
Figure 4.
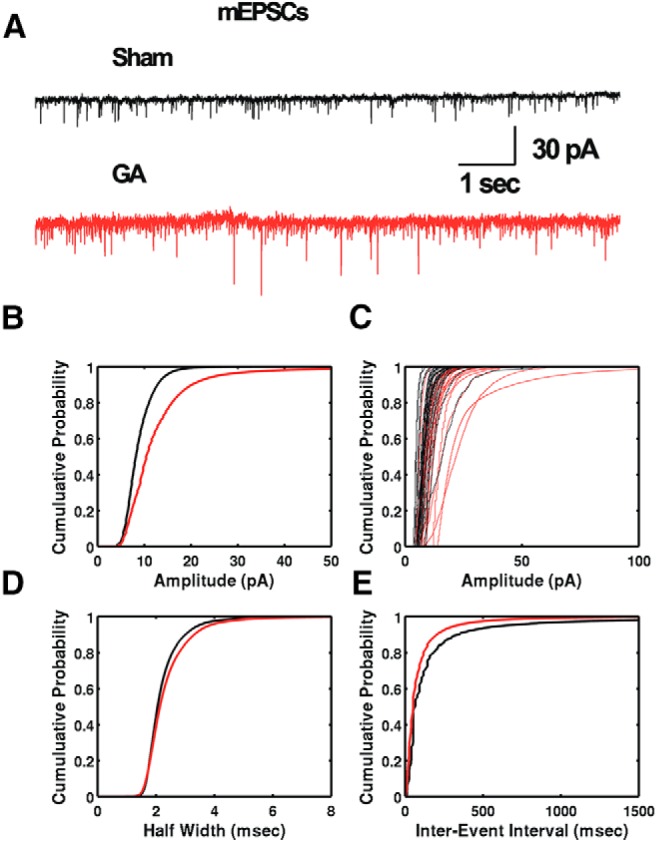
GA exposure alters nRT neuron mEPSC properties. A, Sample of original mEPSC traces from sham (black) and GA-treated (red) nRT neurons. B–E, Plots describing CDFs of isolated mEPSC events in the sham group (78,987 events) and the GA group (154,951 events) demonstrate a significant (p < 0.05, LMM) increase in the amplitude (B,C) and no significant change (p > 0.05, LMM) in kinetics (D) and frequency (E) of events. B, D, E, Solid lines indicate averages of all events for the sham (black lines) and GA (red lines) groups. C, CDFs for the amplitudes of mEPSCs in all nRT neurons used for this analysis in sham (black lines, 29 neurons) and GA (red lines, 28 neurons) groups. Data presented were obtained from 9 GA-treated animals and 8 sham-treated animals.