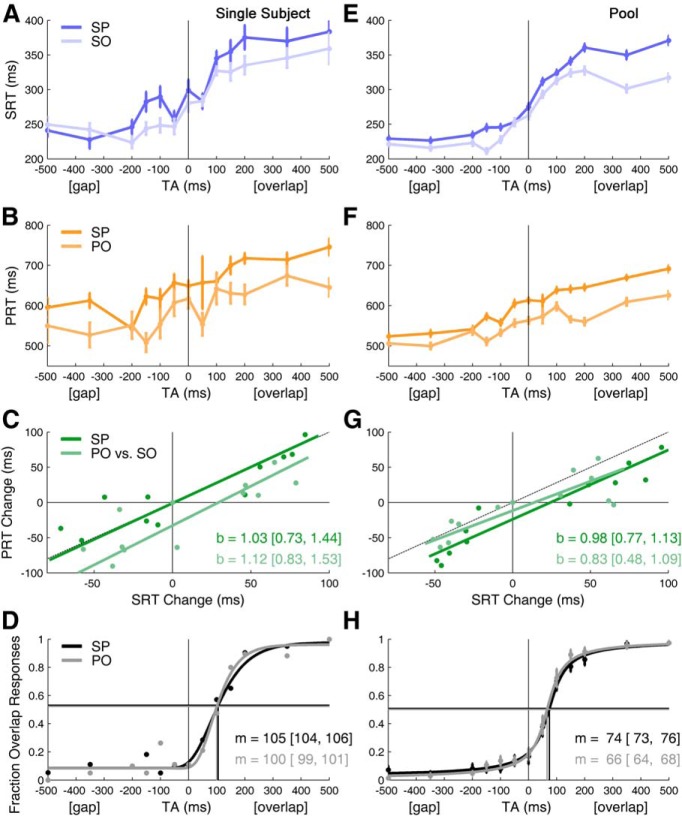
Figure 2.
Saccade and perception reaction times, and perceptual transition from gap to overlap, depend on TA. Left column shows results from a single subject. Right column shows the results from averaging across all 12 subjects (Pool). A, E, Show SRTs. B, F, Show PRTs. C, G, Orthogonal linear regression comparing reaction time changes (i.e., times are shifted so that the mean value is zero at TA = 0). (Dashed line indicates x = y, b = regression slope with [95% CI].) D, H, Psychometric function, m = threshold (i.e., TA at inflection point of function) [95% CI]. Horizontal lines indicate the chance levels. Note that the threshold is not at TA = 0, as expected in the case of a faithful perception; instead there is a misperception of small overlaps as gaps (in H, dots and bars are mean ± 1 SEM of the 12 subjects).

