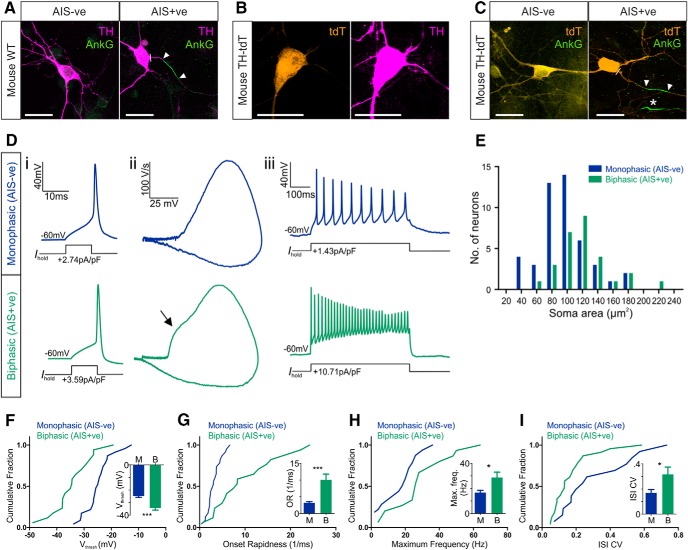
Figure 2.
Functional differences between AIS− and AIS+ OB dopaminergic neurons. A, Example maximum intensity projection images of wild-type (WT) mouse OB dopaminergic neurons costained for TH and ankyrin-G (AnkG). AIS− cells (left) lack AnkG staining; AIS+ cells (right) have a clear AnkG-defined axonal region. In these and all subsequent images, lines show axon start; arrowheads show AIS start and end positions. Scale bars, 20 μm. B, Example maximum intensity projection image of a tdT-expressing neuron from a TH–Cre × Rosa–Tdt mouse OB culture, colabeled for TH. C, Example maximum intensity projection images of TH–tdT neurons costained for AnkG. AIS− cells (left) lack AnkG staining; AIS+ cells (right) have a clear AnkG-defined axonal region. Asterisk shows the AIS of a tdT− neighboring cell. D, Example current-clamp traces from monophasic (AIS−; top) or biphasic (AIS+; bottom) TH–tdT neurons. i, Action potentials fired to threshold 10 ms somatic current injection. ii, Phase plane plots of the spikes shown in i. Arrow points to the AIS-dependent first action potential phase. iii, Action potentials fired at maximum frequency to 500 ms somatic current injection. E, Histogram of soma area. F–I, Cumulative distributions and mean ± SEM plots (insets) for voltage threshold (Vthresh; F), onset rapidness (OR; G), maximum frequency (Max. freq.; H), and interstimulus interval CV (ISI CV; I) in monophasic (M) and biphasic (B) TH–tdT neurons. t test (F, H) or Mann–Whitney test (G, I), *p < 0.05, ***p < 0.001.

