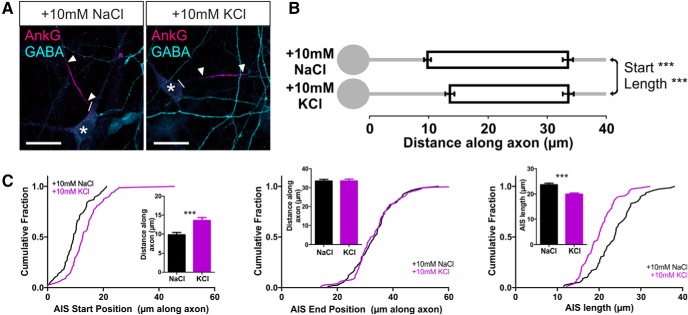
Figure 5.
Standard AIS plasticity in non-GABAergic OB neurons. A, Example maximum intensity projection images show ankyrin-G (AnkG)-positive AISs in rat GABA− OB neurons in 24 h control and depolarized conditions. Asterisks highlight non-GABAergic cell bodies. Lines show axon start; arrowheads show AIS start and end positions. Scale bars, 20 μm. B, AIS plots show the mean ± SEM AIS start and end positions for each group. Mann–Whitney test, ***p < 0.001. C, Cumulative distributions and mean ± SEM plots (insets) for AIS start position, end position, and length for each group. Mann–Whitney test, ***p < 0.001.

