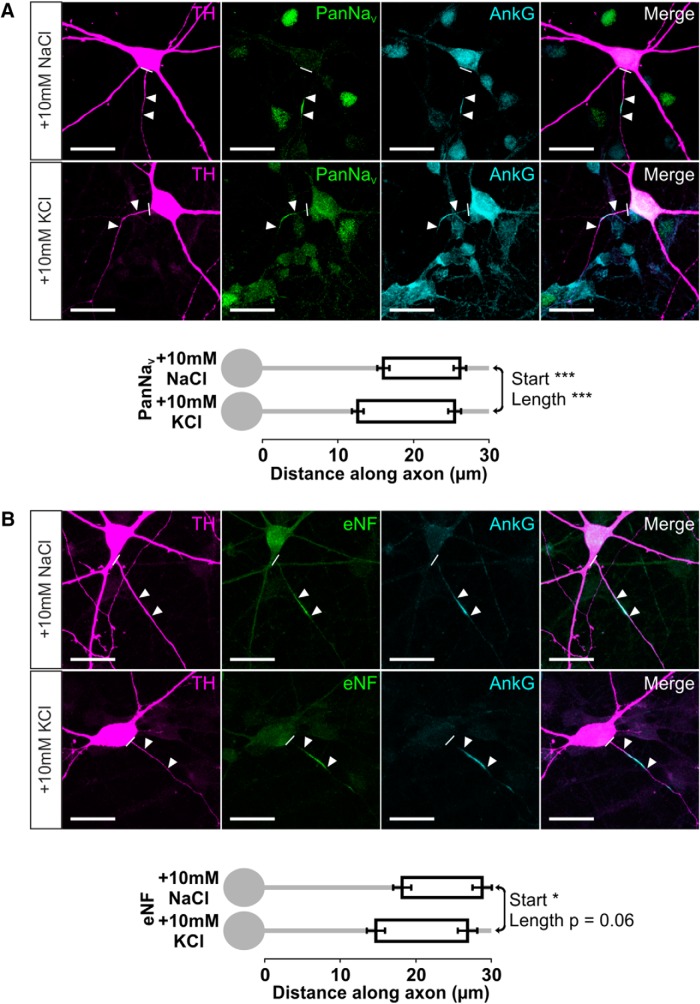
Figure 6.
Inverted AIS plasticity also occurs in the sodium channel and neurofascin distributions of OB dopaminergic neurons. A, Example maximum intensity projection images (top) of TH+ rat OB neurons costained for all NaV1 subunits (PanNaV) and ankyrin-G (AnkG) in 24 h control and depolarized conditions. Note the high background in AnkG staining attributable to pepsin treatment for PanNaV antigen retrieval (see Materials and Methods). In these and all subsequent images, lines show axon start; arrowheads show AIS start and end positions. Scale bars, 20 μm. AIS plots (bottom) show the mean ± SEM AIS start and end positions for each group. Mann–Whitney test, ***p < 0.001. B, Example maximum intensity projection images (top) of TH+ rat OB neurons costained for an extracellular epitope of neurofascin (eNF) and AnkG in 24 h control and depolarized conditions. AIS plots (bottom) show the mean ± SEM AIS start and end positions for each group. Mann–Whitney test, *p < 0.05.

