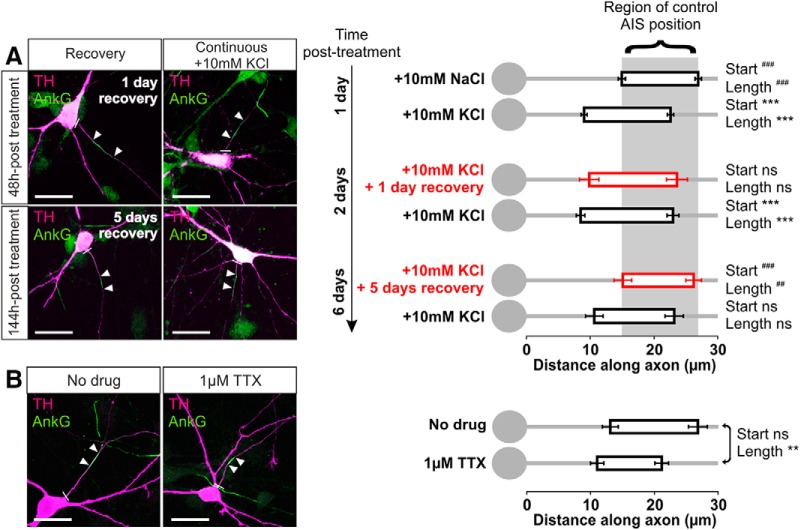
Figure 7.
Bidirectional AIS plasticity in OB dopaminergic neurons. A, Example maximum intensity projection images (left) and AIS plots (right) of rat OB neurons depolarized for 1 d and then either returned to control conditions (recovery) or subjected to continued high potassium treatment for an additional 1 or 5 d. Note the high background in AnkG staining attributable to pepsin treatment for concurrent PanNaV label (see Materials and Methods, Results). In these and subsequent images, lines show axon start; arrowheads show AIS start and end positions. Scale bars, 20 μm. Dunn's post hoc test following Kruskal-Wallis one-way ANOVA, ***p < 0.001 versus 10 mm NaCl 24 h; ##p < 0.01 and ###p < 0.001 versus 10 mm KCl 24 h; ns, nonsignificant versus both 10 mm NaCl 24 h and 10 mm KCl 24 h. B, Example maximum intensity projection images (left) and AIS plots (right) of control (no drug) or 24 h TTX-treated rat OB neurons. Mann–Whitney test, **p < 0.01; ns, nonsignificant.

