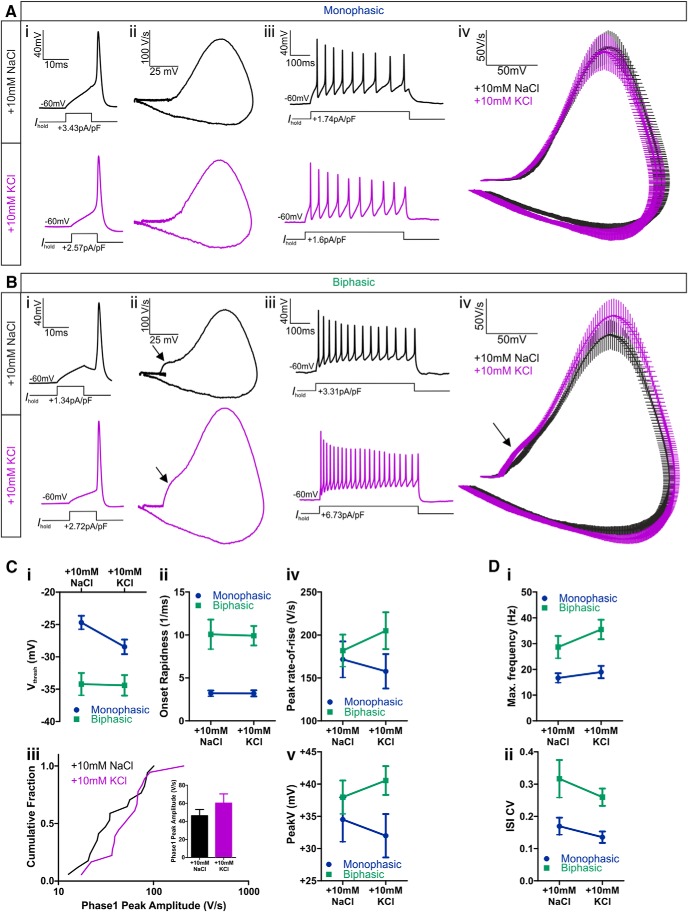
Figure 9.
Action potential properties of AIS+ and AIS− OB dopaminergic cells after 24 h control or depolarization treatment. A, B, Example current-clamp traces from monophasic (A) or biphasic (B) TH–tdT neurons after 24 h 10 mm NaCl or KCl treatment. i, Action potentials fired to threshold 10 ms somatic current injection. ii, Phase plane plots of the spikes shown in i. iii, Action potentials fired at maximum frequency to 500 ms somatic current injection. iv, Overlaid mean ± SEM phase plane plots from each treatment group. Arrows point to the AIS-dependent first action potential phase in biphasic neurons. C, Comparisons of single spike properties. i–v, Plots of the mean ± SEM for all groups. i, Voltage threshold (Vthresh); ii, onset rapidness; iv, peak rate-of-rise; v, peak voltage (V). iii, Cumulative fraction plot and mean ± SEM plot (inset) for first phase peak amplitude in biphasic neurons. D, Comparisons of multiple spiking properties. Plots of mean ± SEM for all groups. i, Maximum firing frequency; ii, CV in interspike interval (ISI).

