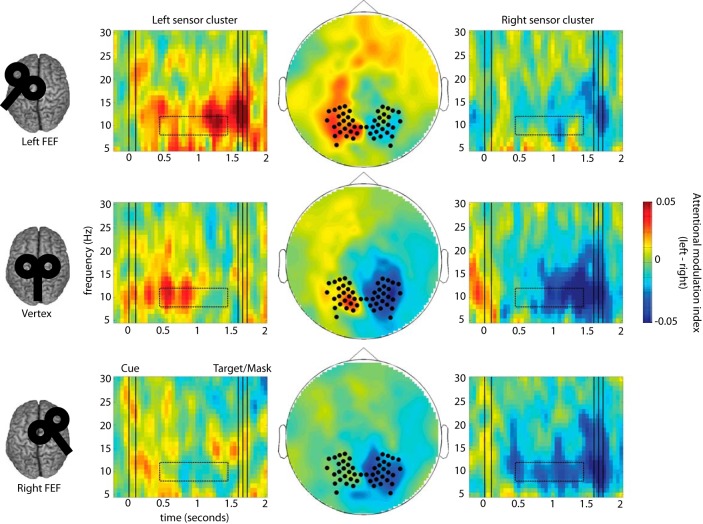
Figure 3.
FEF cTBS produces site-specific disruption of anticipatory alpha power modulation. Time-frequency representations (TFR) of the attentional modulation index of power [MI = (attention left − attention right)/(average over all attention and TMS conditions)] are shown separately for left and right sensor ROIs (left and right column) and for each TMS condition (rows). The middle column shows a topographical representation of MI at 8–12 Hz between 0.35 and 1.35 s after the cue in the cue-target interval (indicated by dotted boxes in the TFRs). Sensor ROIs (indicated by black dots) were predefined based on the average across conditions (see Materials and Methods). In the control condition (vertex cTBS), alpha modulation (ipsilateral increase and contralateral decrease in alpha power relative to the attended direction) is clearly visible in both hemispheres. By contrast, after cTBS to either FEF there is a marked reduction in alpha modulation in the hemisphere contralateral to stimulation.

