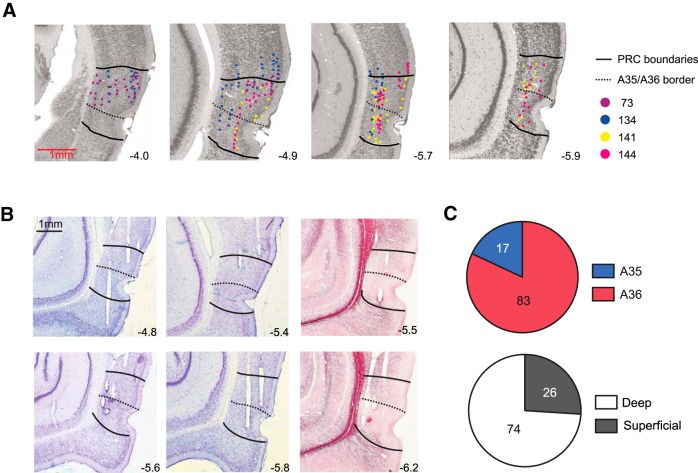
Figure 4.
Histological verification of tetrode positions and the number of neurons recorded from the PRC. A, The histological sections containing the PRC were obtained from an online atlas (http://cmbn-approd01.uio.no/zoomgen/hippocampus/home.do). Using those online images as templates, the locations of individual tetrodes were marked with dots (color-coded for different animals). Regional boundaries of the PRC (solid lines) and its subfields A36 and A35 (dotted lines) were demarcated based on the online atlas and the standard atlas (Paxinos and Watson, 2007). Numbers indicate the relative positions (mm) of the sections from bregma. B, Representative histological sections with tetrode tracks. First and second columns show Nissl-stained tissues. Third column shows myelin-stained sections. C, Pie charts for showing the number of units in different subregions in the PRC. Only units that satisfied the unit-isolation criteria and were used in the final analyses are shown. Top, A35 and A36. Bottom, deep and superficial layers.

