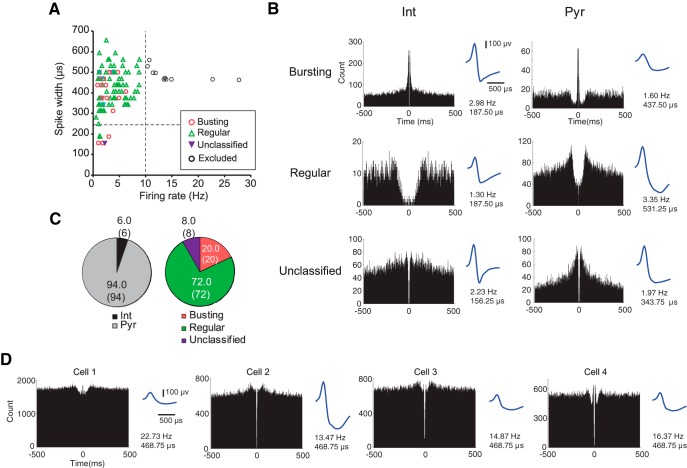
Figure 5.
Classification of PRC neurons. A, A scattergram showing the relationships between the average firing rate and the average spike width (peak-to-trough) of PRC units recorded in the current study. Vertical dashed line indicates the criterion level of firing (10 Hz). Ten units were eliminated based on the criteria (black circles). Horizontal dashed line indicates the cutoff point of a spike width (250 μs) that separated putative interneurons and pyramidal neurons. B, Representative autocorrelograms (time window = ±500 ms, bin size = 1 ms) drawn for putative interneurons (Int, left) and pyramidal neurons (Pyr, right) in the PRC. Shown on the right of each autocorrelogram is the averaged waveform of a neuron. The mean firing rate and spike width of a neuron were indicated below the waveform. On the basis of the autocorrelogram characteristics, cells were classified into bursting (top), regular (middle), and unclassified (bottom) neurons. C, Pie charts showing the percentage of PRC units categorized into putative interneurons and pyramidal neurons based on the spike width criterion (left), and the percentage of neurons categorized based on autocorrelograms (right). The number in the parentheses indicates the number of units. D, Examples of the autocorrelograms and waveforms of the PRC units excluded from the main analysis due to high firing rates (>10 Hz).

