
Figure 9.
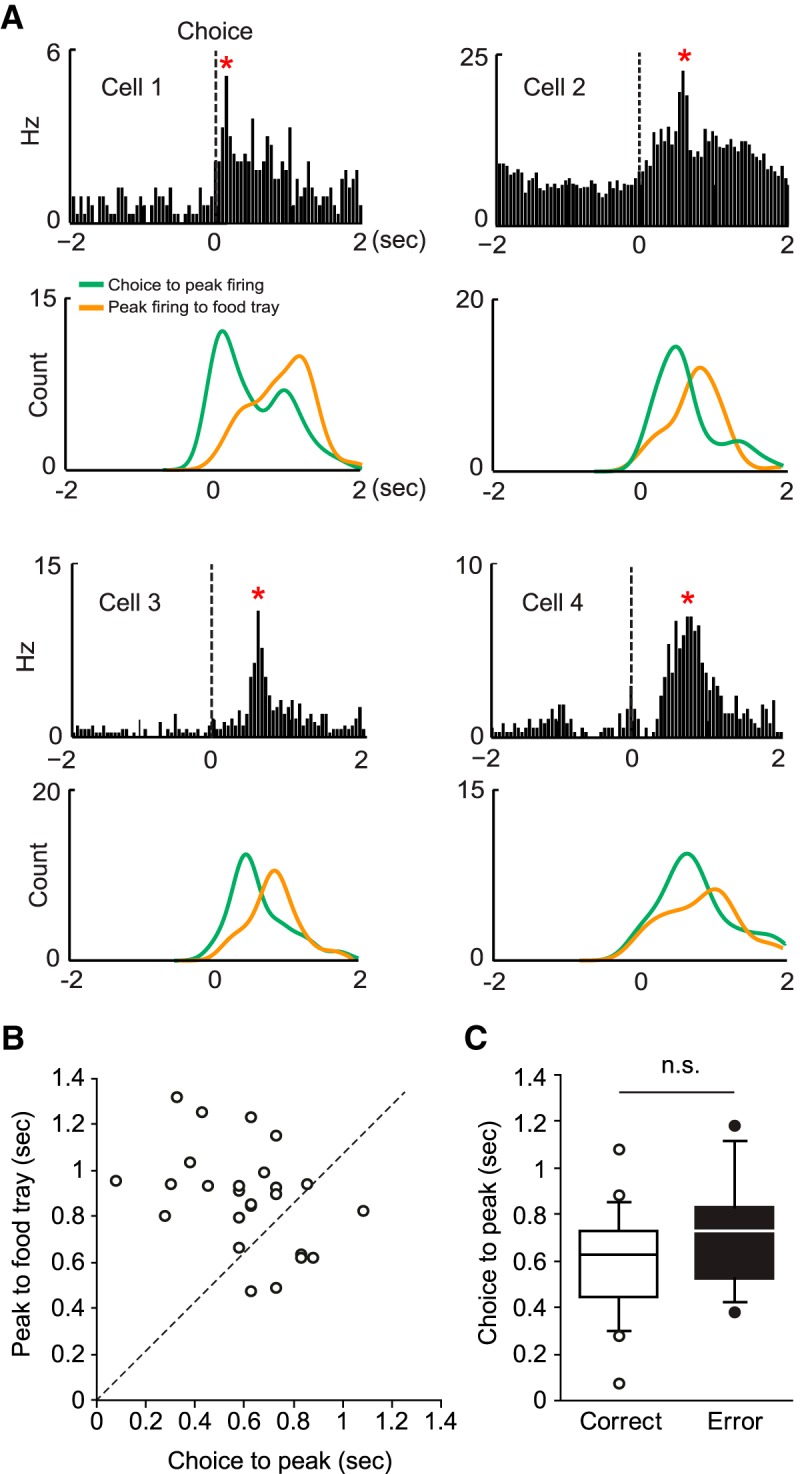
Activity of PRC neurons in the post-choice period conveys trial outcome-related signals. A, The firing-rate distribution of a neuron in the PRC is shown (top) 2 s before and after the choice responses (dashed line). *Time bin in which the maximal firing rate was observed. Shown below is the histogram of the latency from the choice response to the peak-firing rate (green) and of the latency from peak firing to the food-tray entry (orange). Four representative neurons were chosen to show that the post-choice firing peaks were more closely related to the choice responses than to the food-tray entries. B, The distribution of the medians of the temporal locations of the firing peaks with reference to the time points associated with the two events (choice response to peak firing and peak firing to food-tray access), illustrated in a scatter plot. The PRC units fired maximally closer to the choice event (x-axis) than to the food-tray entry event (y-axis). Dashed line indicates the points where the peak-firing location maintains equal distances from the two events. C, Similar choice-to-peak latencies were observed in cells showing a peak firing following a correct response and those following an error. n.s., Not significant.