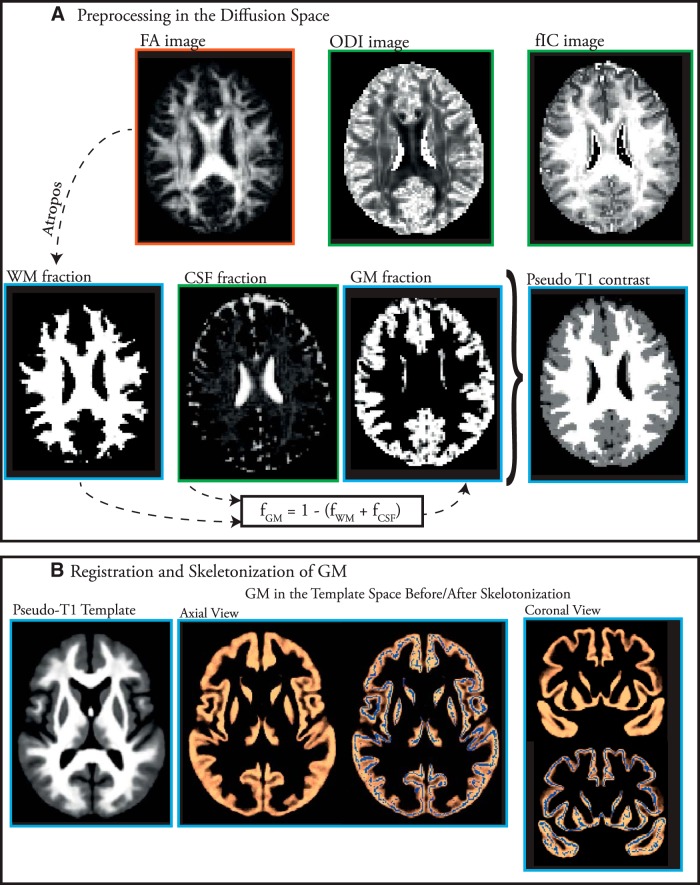
Figure 1.
Overview of the pipeline proposed in this study. A, Diffusion image processing steps. FA maps were created by fitting the DTI model (orange box); the CSF fraction, ODI, and neurite density (νIN) images were generated by applying the NODDI model to the diffusion images (green boxes). WM and GM fraction were estimated indirectly. Finally, images with a pseudo-T1 contrast were generated for registration steps. B, Registration and skeletonization of GM. A norm-template was created by iterative nonlinear registration of pseudo-T1 images.

