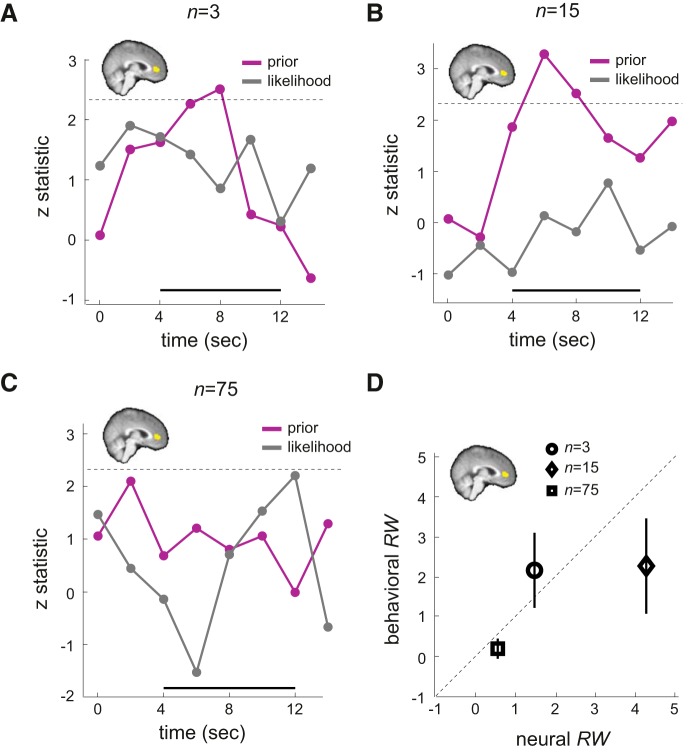
Figure 5.
Independent ROI analysis on mPFC. For the independent, unbiased ROIs in mPFC that were found to track posterior information, we estimated the time-series of effect size for prior information (purple) and likelihood (gray) separately for each sample-size condition. The y-axis represented the z-statistic of the effect size. A, When sample size was small (n = 3). B, When sample size was medium (n = 15). C, When sample size was large (n = 75). The thick black line at the bottom indicates the time points of interest. The dashed horizontal line indicated the z-threshold corresponding to p = 0.05 corrected for the number of time points tested. D, Behaviorally estimated relative weight (behavioral RW) is plotted against the neural measure of RW (neural RW) obtained from mPFC. Error bars represent ±1 SEM. Different symbols represent different sample-size conditions.

