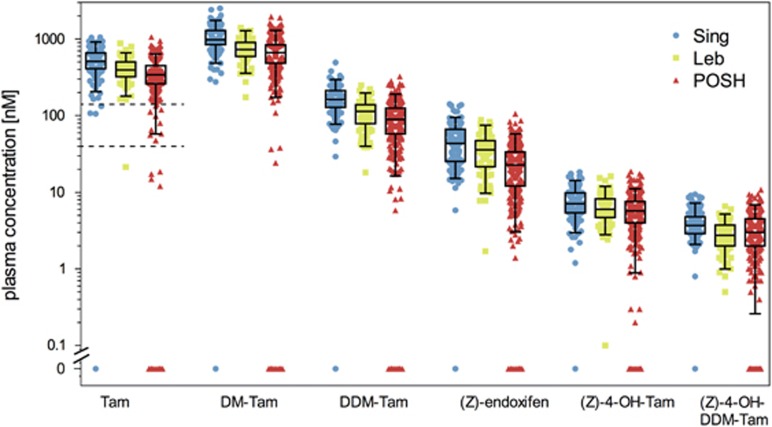
Figure 2.
Metabolic profiling for tamoxifen (Tam) and five measured metabolites, N-desmethyltamoxifen (DM-Tam), N,N-didesmethyltamoxifen (DDM-Tam), (Z)-endoxifen, 4-hydroxytamoxifen [(Z)-4-OH-DDM-Tam] and norendoxifen [(Z)-4-OH-DDMT-Tam] in study cohorts from Singapore (Sing, N=164), Lebanon (Leb, N=78) and Prospective study of Outcomes in Sporadic versus Hereditary breast cancer (POSH, N=345). Metabolite concentrations are presented as boxplots with whiskers defined by the 5th and 95th percentiles and extreme values outside the whiskers. The two dashed lines for Tam delineate putative non-compliant (⩽40 nM) and poorly compliant (40–150 nM) patients as defined from Tam plasma concentrations. Patients with Tam concentrations <150 nM were excluded from further analyses.

