
Figure 2. Hessian fly induces higher levels of enzymatic activity and transcript abundance of glutathione synthetases.
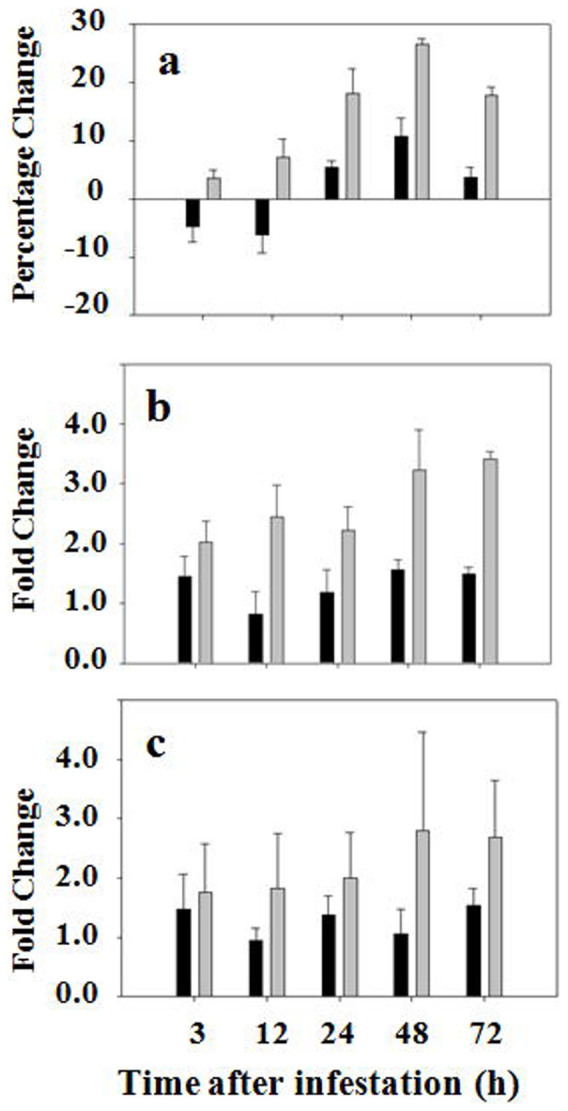
Black and grey bars represent data from susceptible (Newton) and resistant (Molly) plants, respectively. (a) Percentage change in enzymatic activity of glutathione synthetases in plants at different time points after Hessian fly infestation. (b) Fold changes of transcript abundance determined by qPCR using the primer pair common to CK156077, AJ579381 and AJ579382. (c) Fold changes of transcript abundance determined by qPCR using the primer pair specific to AJ579380.