
Figure 3. Hessian fly induces higher levels of enzymatic activity and transcript abundance of glutathione peroxidases in both resistant and susceptible plants.
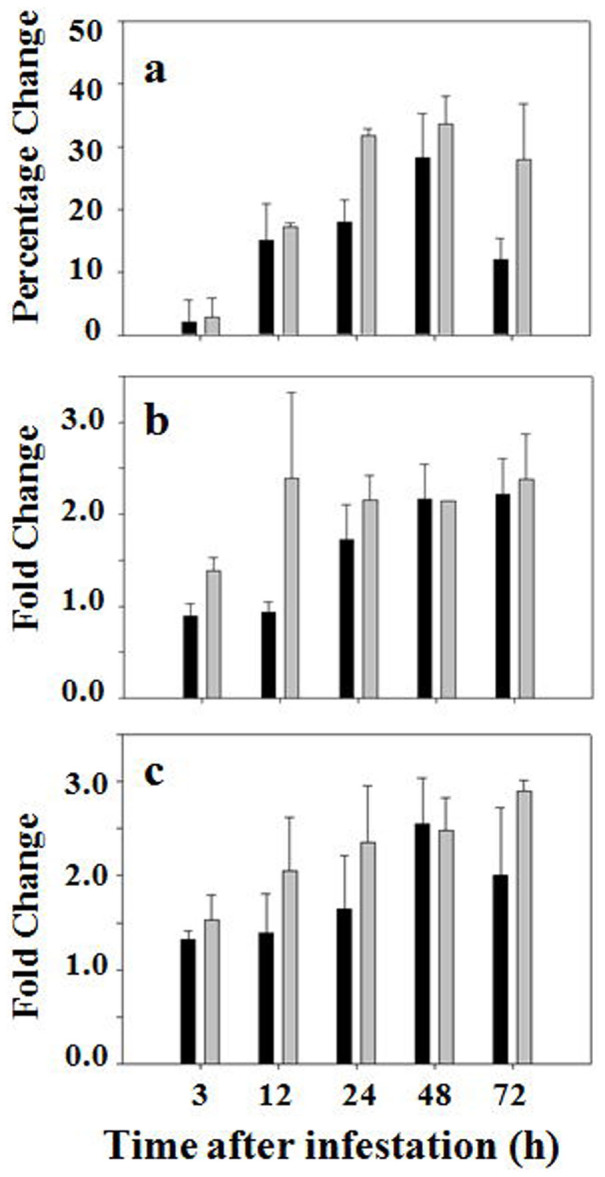
Black and grey bars represent data from susceptible (Newton) and resistant (Molly) plants, respectively. (a) Percentage change in enzymatic activity of glutathione peroxidases in plants at different time points after Hessian fly infestation. (b) Fold changes of transcript abundance determined by qPCR using the primer pair specific to BJ254939. (c) Fold changes of transcript abundance determined by qPCR using the primer pair specific to AY364468.