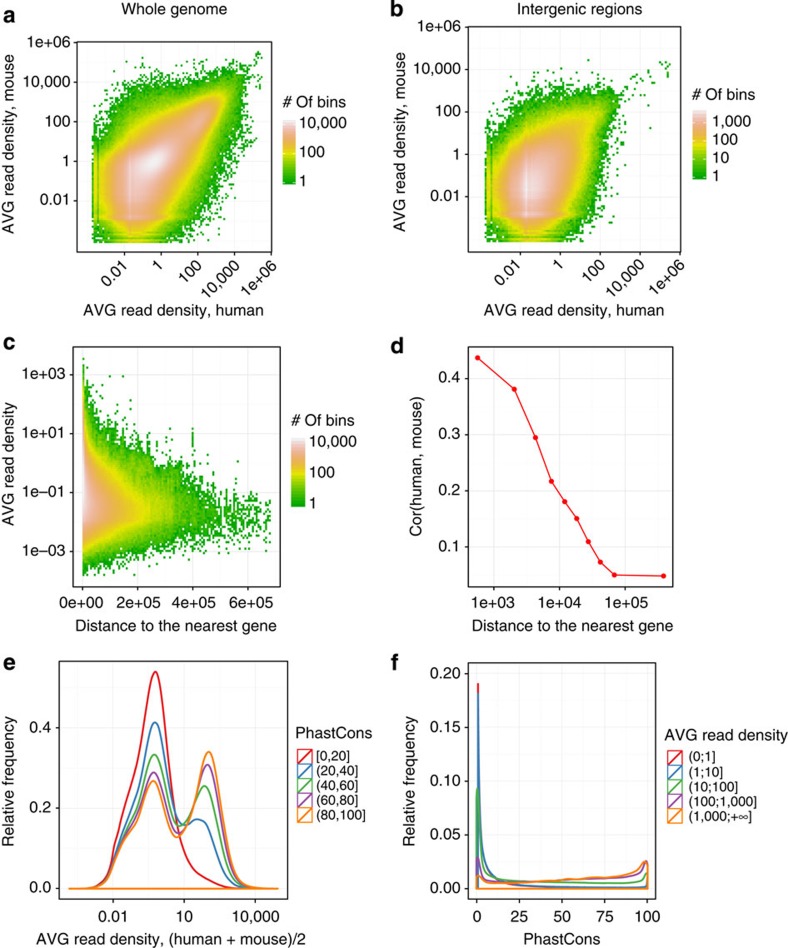
Figure 2. Genome-wide conservation of expression profiles.
(a) The joint distribution of log10 average (AVG) read density in orthologous 100-nt bins in human (x-axis) and in mouse (y-axis); cc=0.67. (b) The distribution in a limited to intergenic regions; cc=0.37. (c) The distribution of log10 average read density in intergenic regions (average between human and mouse) as a function of the distance from the nearest gene. (d) Correlation of log10 average read density in human and mouse as a function of distance from the nearest gene. (e) The distribution of log10 average read density in 100-nt bins as a function of phastCons score (conservation score across 45 vertebrate species). (f) The distribution of phastCons score of a 100-nt bin as a function of the average read density.

