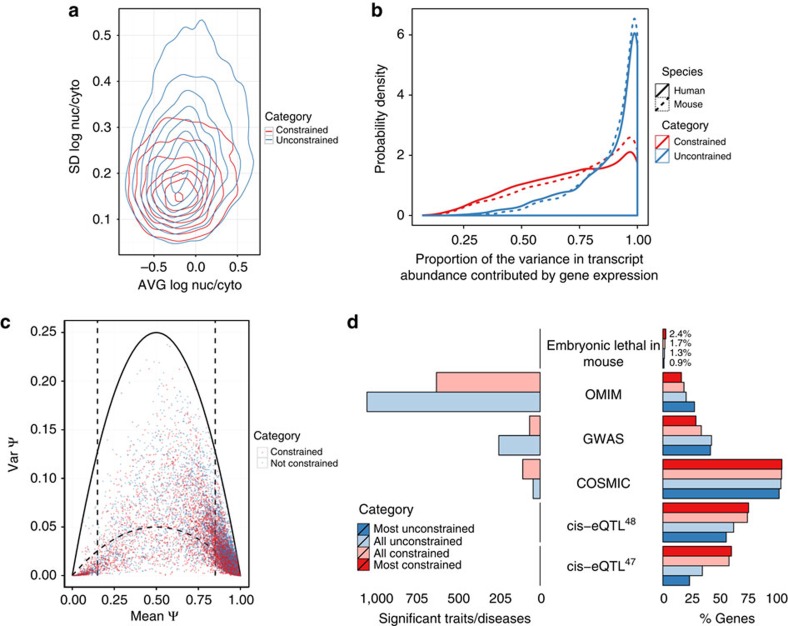
Figure 6. Other properties of constrained genes.
(a) Contour plots of the joint probability distribution of the average versus standard deviation (s.d.) of log10 nuclear-to-cytosolic ratio in constrained and unconstrained genes. (b) Distribution of the proportion of the variance in transcript abundance across human and mouse samples that can be explained by the overall variance in gene expression. Values close to 1 indicate that changes in abundance of transcript isoforms originate mostly from changes in gene expression, values close to 0 suggest that most of these changes are due to splicing changes in the relative proportion of transcript isoforms. (c) Mean versus variance of splice junction inclusion (ψ) in constrained and unconstrained genes. To identify junctions with constrained inclusion at intermediate levels, we set a threshold (inner parabola) of 20% of the maximum variance for the given mean in a Bernoulli distribution (outer parabola) in the interval of mean inclusion (0.15, 0.85). (d) The percent of all and of the 1,000 most constrained and unconstrained genes (right) that are lethal in mice according to the Jax mice embryonic lethality database54, have hits in OMIM45, the NHGRI GWAS catalogue46, COSMIC44 and that have eQTLs47,48. On the left, the number of significant traits/diseases associated to constrained and unconstrained genes in OMIM, the NHGRI GWAS catalogue and COSMIC.

