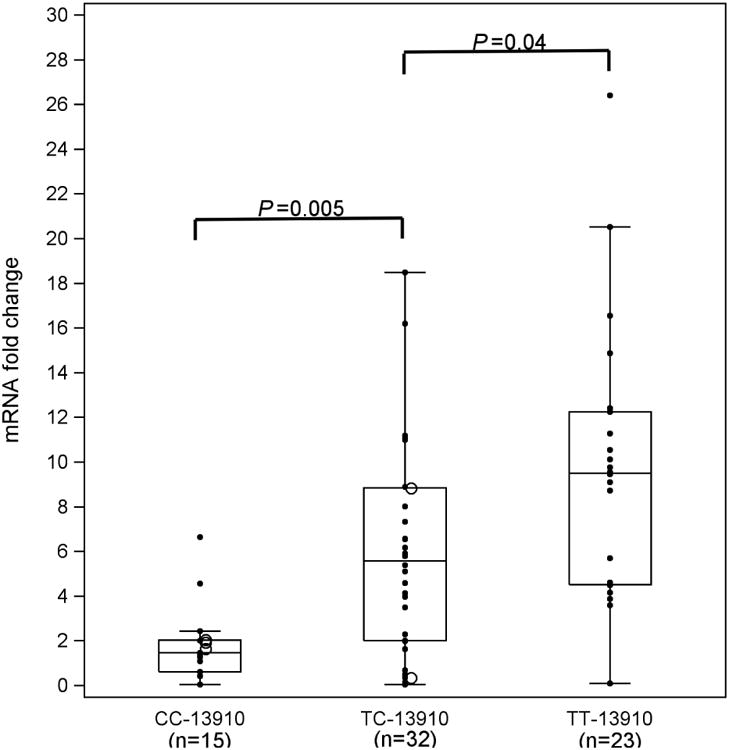
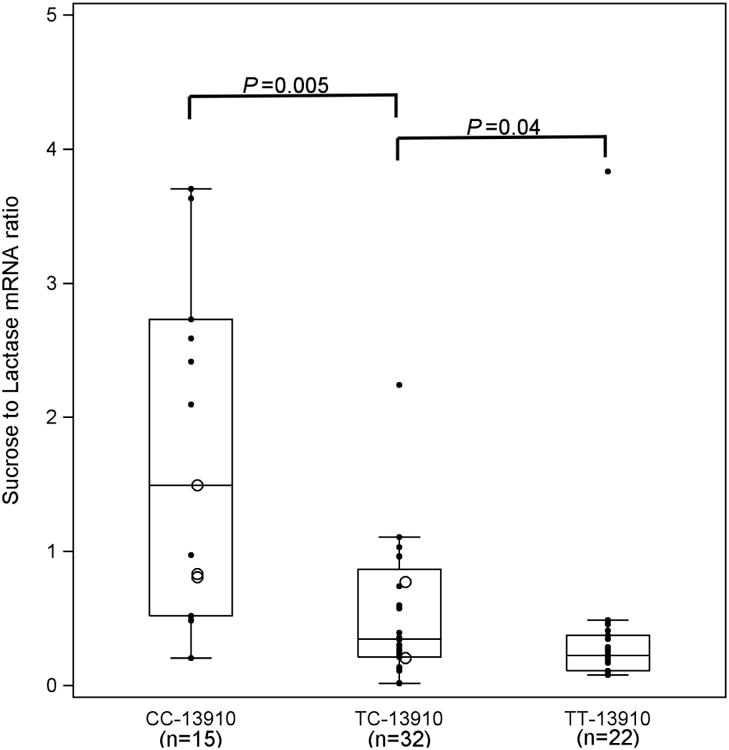
Figure 3.


a Lactase mRNA fold change by genotype at -13910. We analyzed lactase mRNA by real time RT-PCR and expressed it relative to a standard sample. The mRNA expression increased from CC -13910 to TT -13910 (P=0.0001).
b Sucrase to lactase mRNA ratios by genotype at -13910. The mRNA expression of sucrase was also analyzed by real time RT-PCR and expressed relative to a standard sample. The relative fold change in sucrase mRNA was compared to relative lactase mRNA levels to generate a ratio, parallel to the methodology used for enzyme ratios (Figure 2b). The sucrase mRNA expression decreased from CC-13910 to TT-13910 (P=0.0001)
