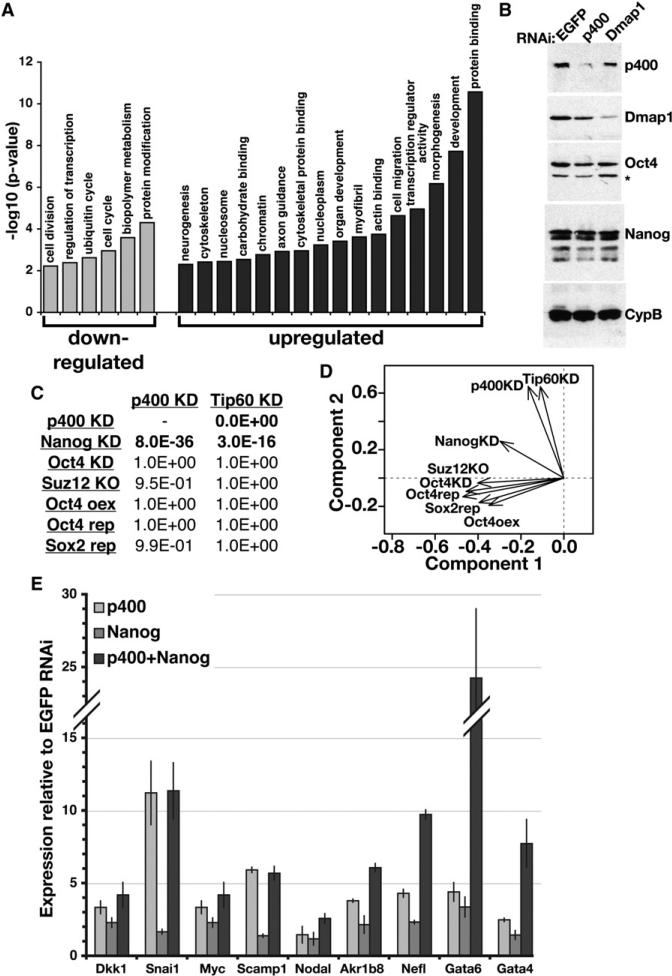
Figure 4. Overlapping Functions of Tip60-p400 and Nanog Revealed by Expression Profiling.
(A) The significance of enrichment of a subset of Gene Ontology (GO) terms common among genes misregulated in p400 KD ESCs. Similar categories were enriched in the Tip60 KD dataset.
(B) Protein levels of Tip60-p400 subunits (p400, Dmap1), TFs (Oct4, Nanog), and a loading control (cyclophilin B, CypB) were determined by Western blotting. The asterisk indicates a background band.
(C) Comparison of ESC expression profiles upon KD, knockout (KO), inducible repression (rep) or overexpression (oex) of the indicated factors (Loh et al., 2006; Masui et al., 2007; Matoba et al., 2006; Pasini et al., 2007). p-values (one-sided Fisher's exact test) indicating statistical significance of overlap with Tip60 or p400 KD are shown.
(D) Principal component analysis of gene expression profiles from (C).
(E) RT-qPCR measuring mRNA levels of Nanogand Tip60-p400-target genes (indicated below) in ESCs depleted of p400, Nanog, or both, relative to control (EGFP)-depleted ESCs. Data are represented as mean ± SD.

