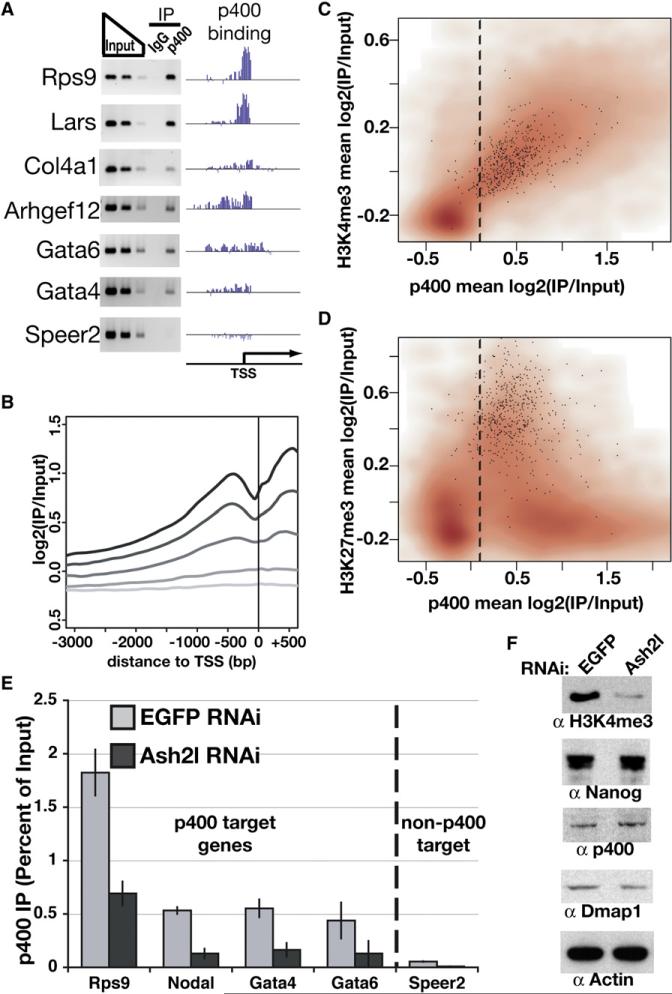
Figure 5. Genome-Wide Location Analysis of p400.
(A) PCR verification of p400 ChIP at genes with varying enrichment of p400. “p400 binding” plots p400 enrichment (y axis) for each probe (x axis) tiling the promoters indicated.
(B) p400 enrichment was plotted relative to the TSS. Genes were binned into quintiles based on expression level in ESCs, ranging from highly expressed genes (black) to nonexpressed genes (lightest gray).
(C and D) Density scatterplots of each gene promoter average for p400 enrichment versus H3K4me3 (Maherali et al., 2007) (C) or H3K27me3 (Maherali et al., 2007) (D) enrichment. Direct targets of Polycomb repressive complex 2 (PRC2) (Boyer et al., 2006) are indicated with black dots. The dashed line separates p400-enriched from nonenriched genes, as in Figure S6.
(E) ChIP in Ash2l or EGFP KD ESCs for p400 measured by qPCR and expressed as a percentage of input. The dashed line separates p400 target genes (according to genome-wide location data and confirmed for several genes in Figure 5A) from a gene without p400 enrichment (Speer2), included as a control. IgG control qPCRs were near zero (Figure S12). Data are represented as mean ± SD.
(F) Western blotting for the proteins indicated in EGFP and Ash2l KD ESCs.

