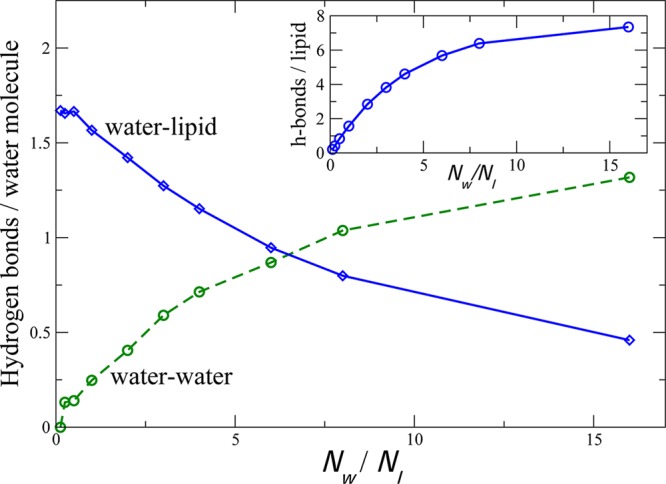
Figure 5.

Hydrogen bonding partners for confined water. The average number of water–lipid and water–water hydrogen bonds is plotted per water molecule in the inner compartment between bilayers as a function of water-to-lipid ratio. The inset shows the number of water-to-lipid hydrogen-bonds per inner-leaflet lipid.
