
Figure 1.
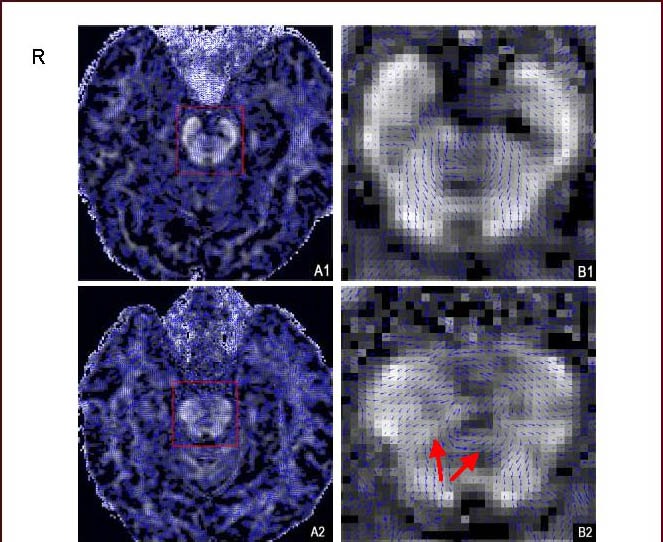
Vector field maps of the healthy subject and the axonal injury patient.
(A1) The vector field map of the healthy subject's brain; (B1) the midbrain within the range of the red rectangle in (A1). (A2) and (B2) show the brain vector field map and midbrain vector field map, respectively, from the axonal injury patient.
In each vector field map, the background shows the fractional anisotropy map, and the foreground shows the corresponding principal diffusion direction in each voxel.