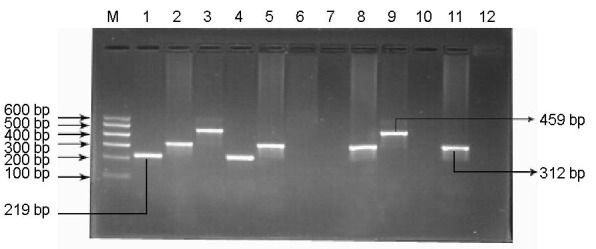
Figure 1.

Electrophoretogram of GSTT1 and GSTM1 gene amplification products.
M: Marker (100–600 bp); lanes 1–3 represent sample “a” (GSTM1+/GSTT1+), lanes 4–6 represent sample “b” (GSTM1+/GSTT1–), lanes 7–9 represent sample “c” (GSTM1–/GSTT1+), lanes 10–12 represent sample “d” (GSTM1–/GSTT1–). GSTM1(+) and GSTM1(+/–) were detected as a fragment at 219 bp, CYP1A1 exon7 was the fragment at 312 bp, GSTT1 (+) and GSTT1(+/-) was the fragment at 459 bp; GSTM1 (–) and GSTT1 (–) were detected as no corresponding fragment. GST: Glutathione S-transferase.
Heterozygous deletion and the present genotype could not be distinguished in the electrophoretogram.
