
Figure 2.
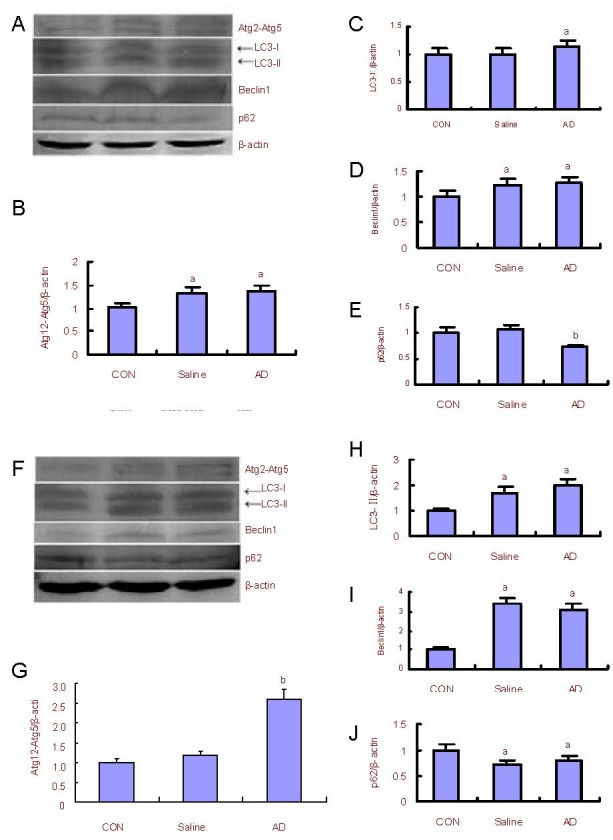
Changes in autophagy-associated proteins and p62 expression in the rat cerebral cortex and hippocampus.
Western blot analysis (A) and quantification of the expression of Atg12-Atg5, LC3-II, beclin1 and p62 in the cerebral cortex of the saline and AD model group as compared with the control (CON) group (adjusted as 1.0) (B–E).
Western blot analysis (F) and quantification of the expression of Atg12-Atg5, LC3-II, beclin1, and p62 in the hippocampus as compared with the control group (adjusted as 1.0) (G–J).
β-actin was used as an internal standard. The assay was performed three times and data were expressed as mean ± SD. aP < 0.05, bP < 0.01, vs. the control group (one-way analysis of variance followed by Dunnett's t-test).
Atg: Autophagy-related genes; LC3: microtubule-associated protein 1 light chain 3; AD: Alzheimer's disease.