
Figure 4.
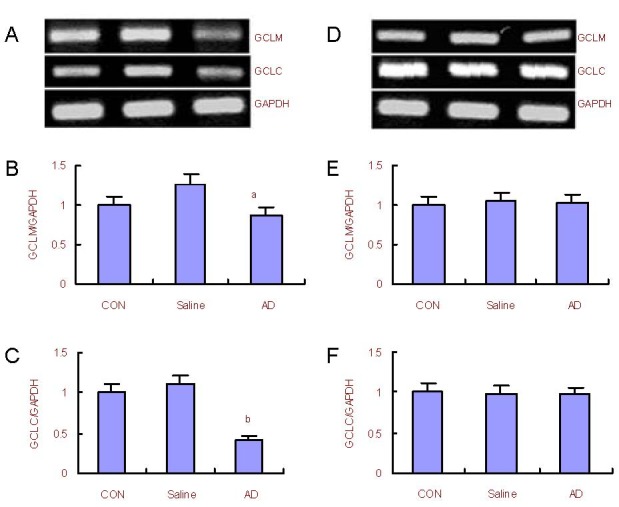
Changes in glutamate cysteine ligase catalytic subunit (GCLC) and glutamate cysteine ligase modulatory subunit (GCLM) mRNA expression in the rat cerebral cortex and hippocampus.
(A) RT-PCR analysis for mRNA expression of GCLM and GCLC in the cerebral cortex; (B, C) quantification of GCLM and GCLC mRNA expression in the cerebral cortex compared with the control (CON) group (adjusted as 1.0).
(D) Reverse transcription-PCR analysis for mRNA expression of GCLM and GCLC in the hippocampus; (E, F) quantification of GCLM and GCLC mRNA expression in the hippocampus compared with the control group (adjusted as 1.0).
GAPDH was used as an internal standard. aP < 0.05, bP < 0.01, vs. control group (one-way analysis of variance followed by Dunnett's t-test). The assay was performed three times and data were expressed as mean ± SD.