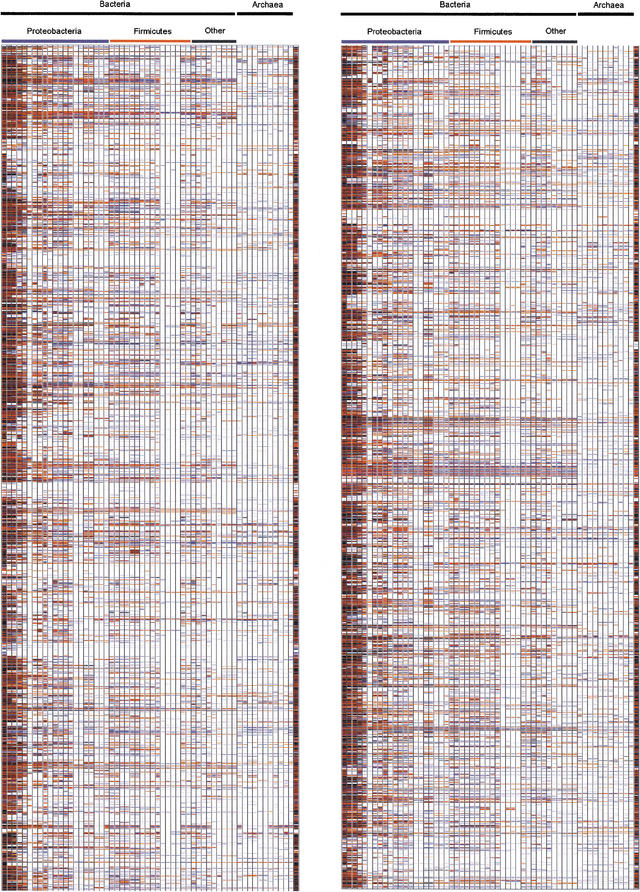
Figure 1.
Genome profile of the Escherichia coli K12 genome against the genomes listed in Table 1. The last genome on the right part of the figure is E. coli O157 again to serve as reference. The Genome Conservation Profile was obtained comparing each protein encoded by the genome of E. coli K12 to each of the databases of all proteins for each organism listed in Table 1. Comparisons were done using the NCBI's BLAST2 for a fast identification of homologous sequences. For each protein of the E. coli K12 genome, we obtain a vector whose components can be either the absence of hit, or the e value of the best hit obtained for a given gene. These values are color coded, and the genomes are arranged following the NCBI taxonomy. This is the picture we obtained. Color codes range from black e = 0.0 to pale blue e = 10−10. The darker the color, the more homologous the genes are with respect to the E. coli counterparts. A full color figure can be seen in the additional information Web page http://bioinfo.cnio.es/data/GenomeProfile/.

