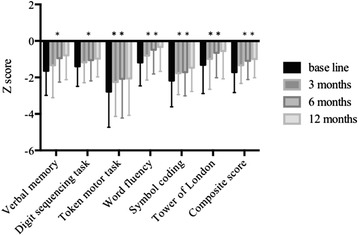
Figure 1.

The change of the scores of Brief Assessment of Cognition in Schizophrenia (BACS). Results of each test were standardized by setting the mean of the normal dataset to zero and the SD to one. BL baseline, 3 m 3 months, 6 m 6 months, 12 m 12 months. *P < 0.05, **P < 0.01, repeat ANOVA. Post hoc analyses were conducted with Bonferroni correction. Verbal memory: BL vs 6 m, P = 0.04, BL vs 12 m, P < 0.01; digit sequencing task: BL vs 12 m, P = 0.01; word fluency: BL vs 6 m, P = 0.03, BL vs 12 m, P < 0.01; symbol coding: BL vs 3 m, P = 0.02, BL vs 12 m, P < 0.01; Tower of London: BL vs 6 m, P = 0.01, BL vs 12 m, P < 0.01; composite score: BL vs 3 m, P = 0.43, BL vs 6 m, P < 0.01, BL vs 12 m, P < 0.01, 3 m vs 12 m, P = 0.04. P > 0.05 for all other paired comparisons.
