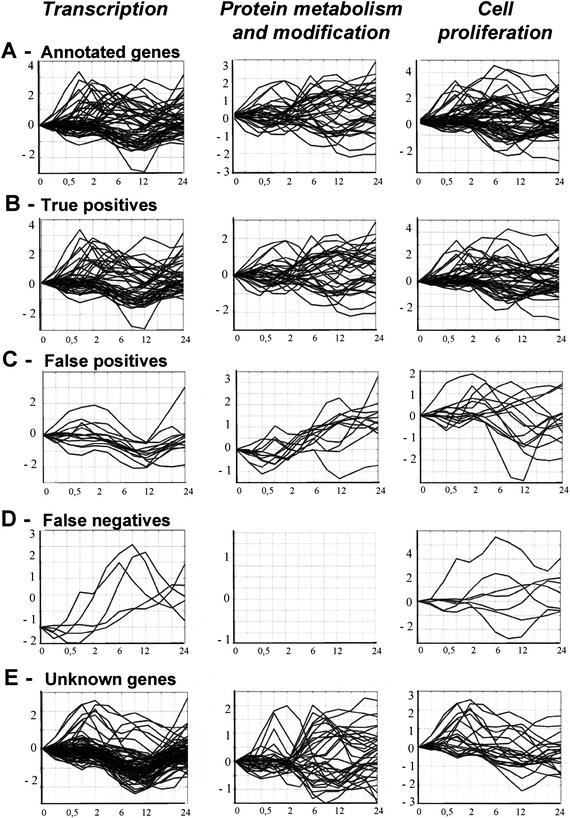
Figure 3.
Expression profiles of annotated and classified genes for the processes transcription, protein metabolism and modification, and cell proliferation. The x-axis shows time, and the y-axis shows log2-transformed gene expression ratios (serum treated vs. control). For each process the following expression profiles are shown: (A) training example genes annotated with the process; (B) training example genes correctly classified to the process, that is, true positives; (C) training example genes classified but not annotated to the process, that is, false positives; (D) training example genes that the rule model failed to classify with the biological process to which they were annotated, that is, false negatives; and (E) unknown (uncharacterized) genes classified to the process.

