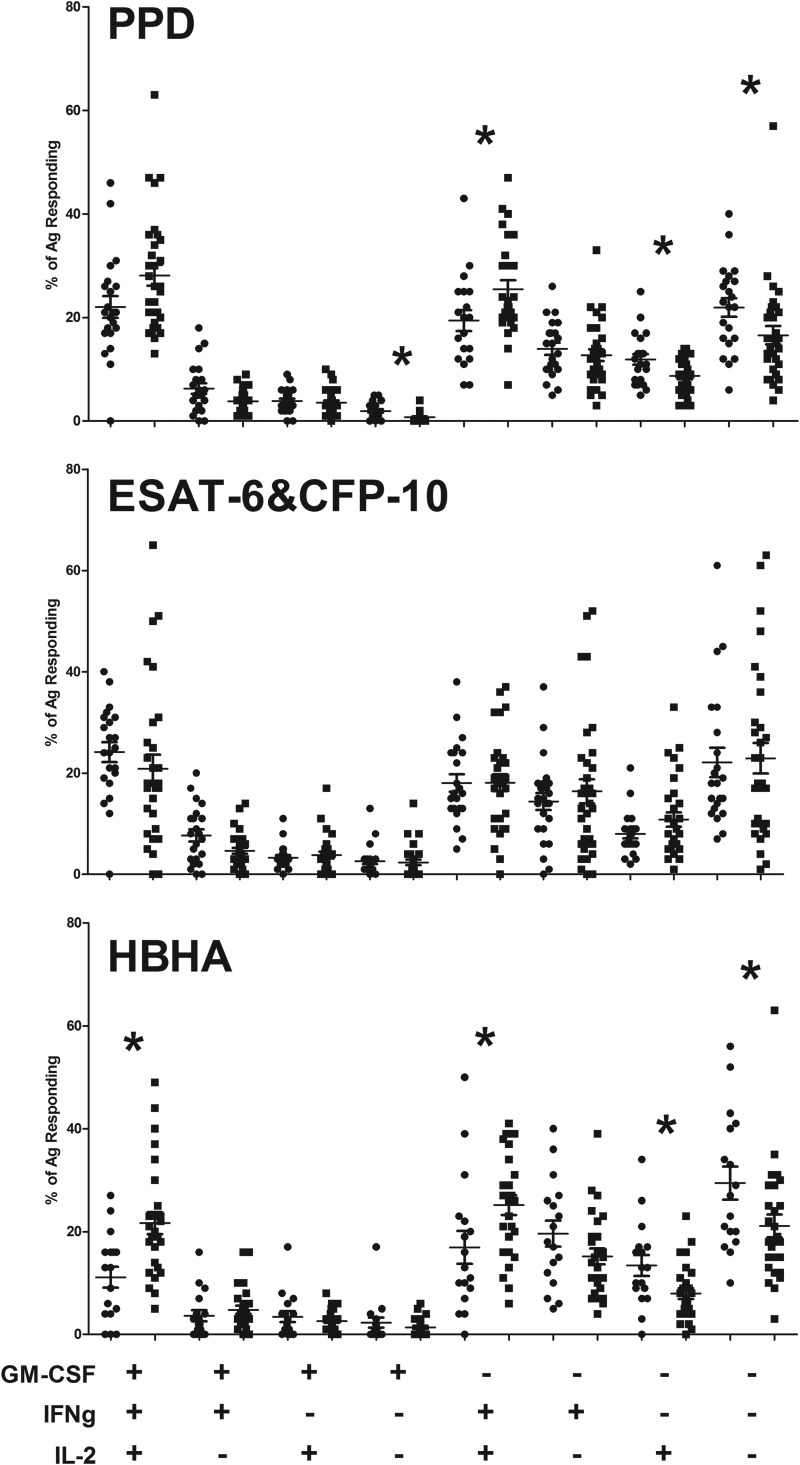
FIG 2.
GM-CSF, IFN-γ, and IL-2 staining in M. tuberculosis antigen-specific cells. The measured percentages of responding cells for each subject (means and standard errors are shown) (circles, actively infected subjects; squares, latently infected subjects) for different combinations of GM-CSF, IFN-γ, and IL-2 staining are shown for the different M. tuberculosis antigens tested. An asterisk indicates significance at a P value of <0.05, as measured by the Mann-Whitney U test for comparisons between the actively and latently infected groups.

