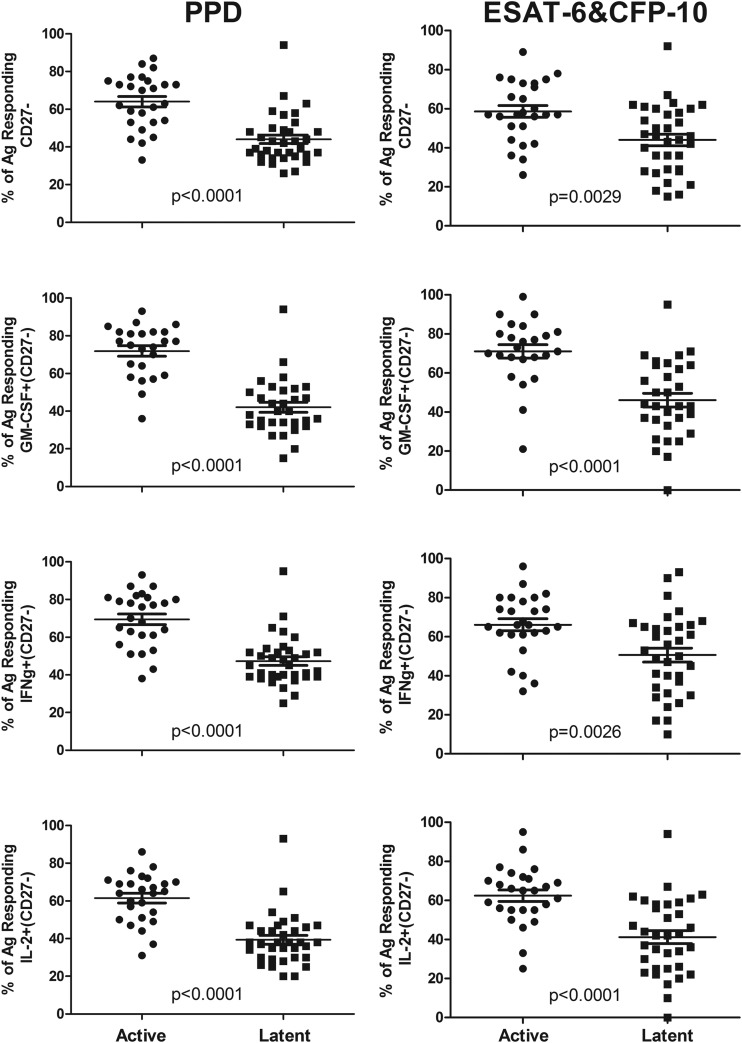
FIG 3.
Proportions of CD27-negative PPD-responding and ESAT-6- and CFP-10-responding cells significantly differ between subjects with active and those with latent TB. The measured percentages of responding cells for each subject (means and standard errors are shown) that were CD27− are shown for total responding, GM-CSF+, IFN-γ+, or IL-2+ cells. (Left) PPD stimulation; (right) ESAT-6 and CFP-10 stimulation. Results for Mann-Whitney U test comparisons between the actively and latently infected groups are displayed.

