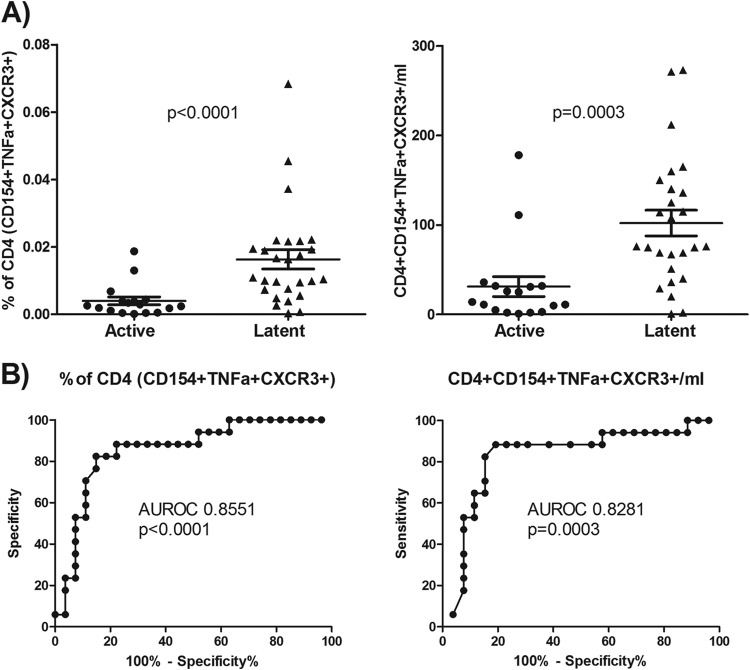
FIG 6.
CXCR3 expression on HBHA-responding cells. (A) CXCR3 expression on HBHA-responding cells as a percentage of CD4 cells (left) and their absolute numbers (right) for each subject. Results for Mann-Whitney U test comparisons between the actively and latently infected groups are displayed. (B) ROC analysis for HBHA-responding cells as a percentage of CD4 cells (left) and their absolute numbers (right), along with their respective areas under the curve and P values.

