
Figure 3.
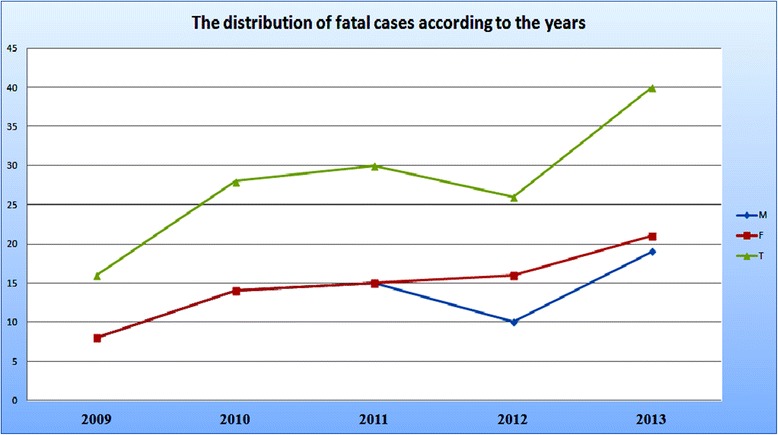
Distribution of fatalities during the years of the study, and the gender differences (M – males; F- females, T-Total) that have become visible only during 2012 and 2013, with a female preponderance.
Official websites use .gov
A
.gov website belongs to an official
government organization in the United States.
Secure .gov websites use HTTPS
A lock (
) or https:// means you've safely
connected to the .gov website. Share sensitive
information only on official, secure websites.
Distribution of fatalities during the years of the study, and the gender differences (M – males; F- females, T-Total) that have become visible only during 2012 and 2013, with a female preponderance.