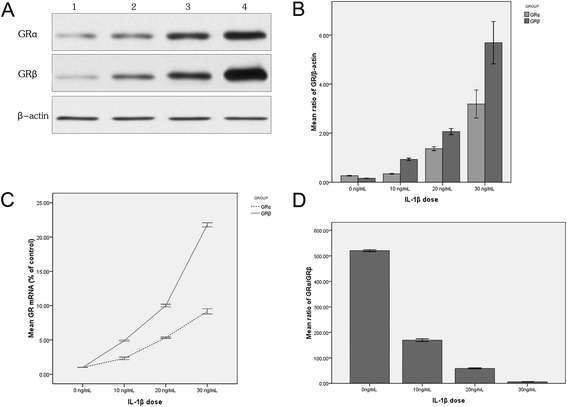
Figure 1.

The expression of GR isoforms induced by IL-1β of different doses in vitro. A represents Western blot results of IL-1β-induced protein expression of GR isoforms. Lanes 1- 4 represent the GR expression in 0 ng/mL, 10 ng/mL, 20 ng/mL and 30 ng/mL IL-1β-treated groups respectively. The GRα and GRβ expression increased with higher IL-1β dosage. B represents the densitometry value (Western blot bands in 1A) ratio of GR isoforms and β-actin. The protein expression of GRα and GRβ increased with the increase of IL-1β dosage, and the GRβ expression increased more significantly than the GRα expression. C represents the mRNA ratio of GR isoforms in IL-1β-induced group and the control group (0 ng/mL). The mRNA expression of GRα and GRβ increased with the increase of IL-1β dosage, and the GRβ expression increased more significantly than the GRα expression. D represents the GRα/GRβ mRNA expression (measured by FQ-RT-PCR) ratio induced by IL-1β. The GRα/GRβ ratio decreased with the increase of IL-1β dosage in nasal polyp tissue. The data presented above are the means (±SD) of three independent experiments with similar trend.
